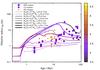
Fig. 6
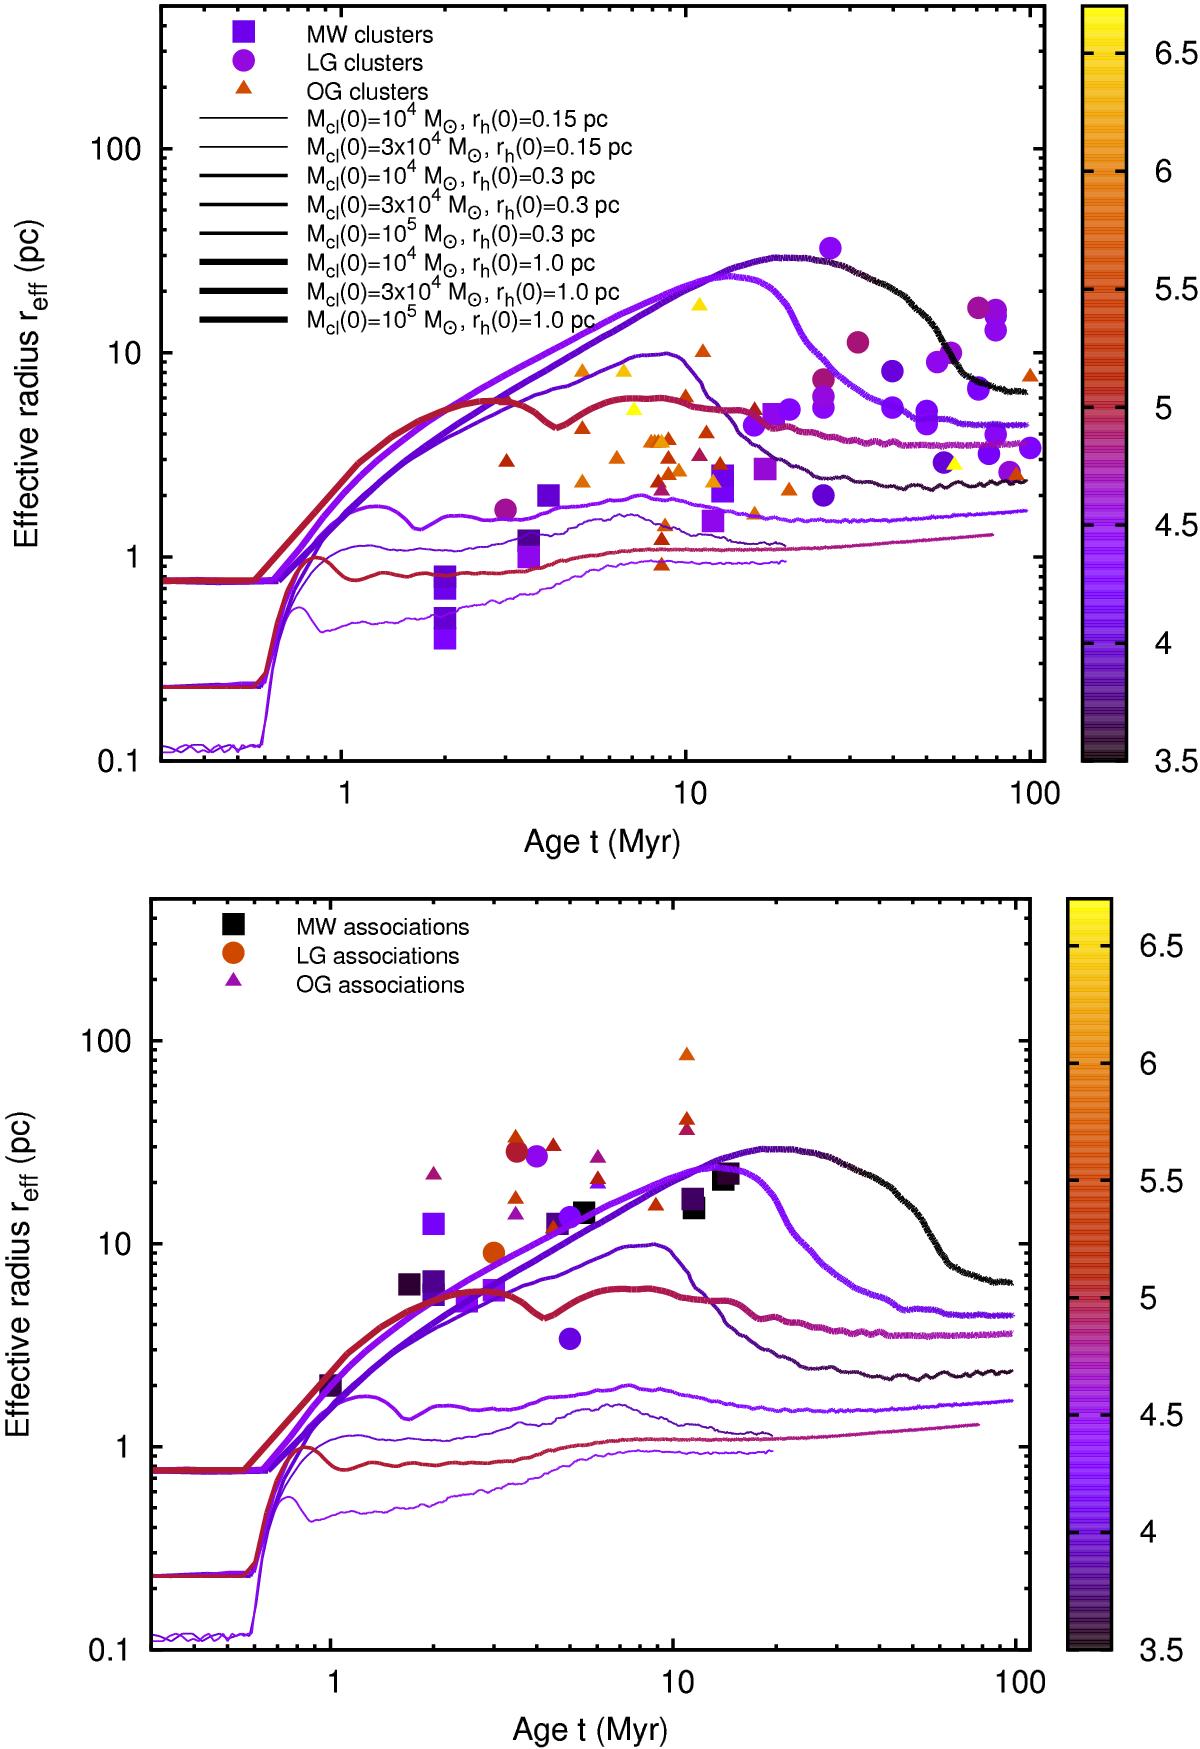
Data points and their colour-coding in both panels are identical to Fig. 3. The curves are the computed evolution of the projected half-mass radii (or effective radii) reff(t), including a gas dispersal phase with star formation efficiency ϵ ≈ 33% (see Table 4, top part and text for details). As in Fig. 3, the curves also follow the same colour-coding according to the corresponding clusters’ instantaneous total bound mass log 10(Mcl(t)) (the same set of curves are overlaid on both panels). These figures imply that even if the YMCs evolve from filament-like compact sizes, such substantial (and explosive) gas dispersal will expand them to their present observed sizes (half-mass radii) in the Milky way and in the Local Group (top panel). However, to reach the sizes of the most extended Local Group YMCs, they need to evolve from rh(0) ≳ 1 pc half-mass radii, unless such objects are low-mass cluster complexes (Brüns et al. 2009). The latter is also true for the young massive associations (bottom panel). See text for details.
Current usage metrics show cumulative count of Article Views (full-text article views including HTML views, PDF and ePub downloads, according to the available data) and Abstracts Views on Vision4Press platform.
Data correspond to usage on the plateform after 2015. The current usage metrics is available 48-96 hours after online publication and is updated daily on week days.
Initial download of the metrics may take a while.