Fig. 9
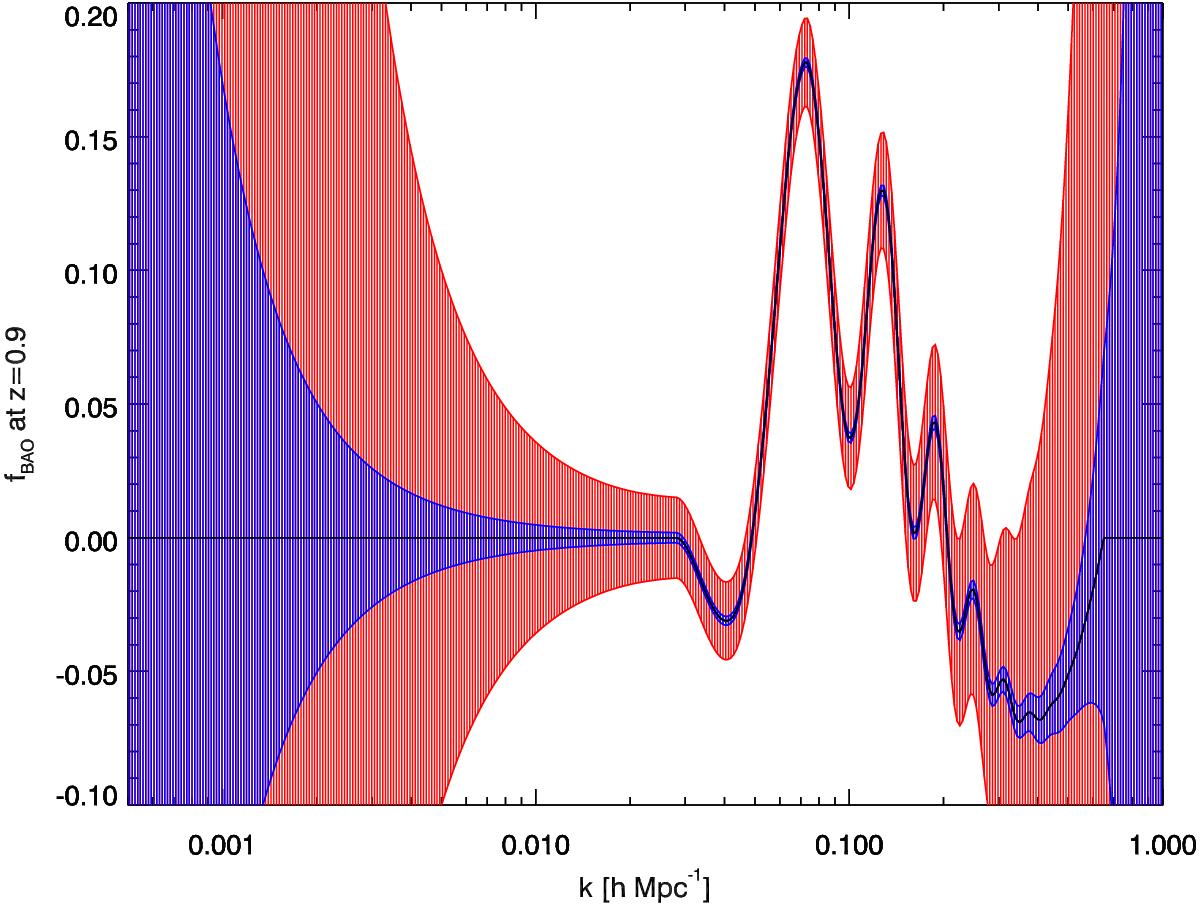
Focus on BAO features: the perturbation power spectrum with error bands for survey 2, which is the 3D 21 cm intensity map. The outer (red) errors are for the nominal 48-day observing first pass (survey 2a). The inner (blue) error band is for a two-year observing run (survey 2b) assuming that the data integrate down and full sensitivity is achieved and thus the errors on the power spectrum decrease inversely with observing time.
Current usage metrics show cumulative count of Article Views (full-text article views including HTML views, PDF and ePub downloads, according to the available data) and Abstracts Views on Vision4Press platform.
Data correspond to usage on the plateform after 2015. The current usage metrics is available 48-96 hours after online publication and is updated daily on week days.
Initial download of the metrics may take a while.