Fig. 7
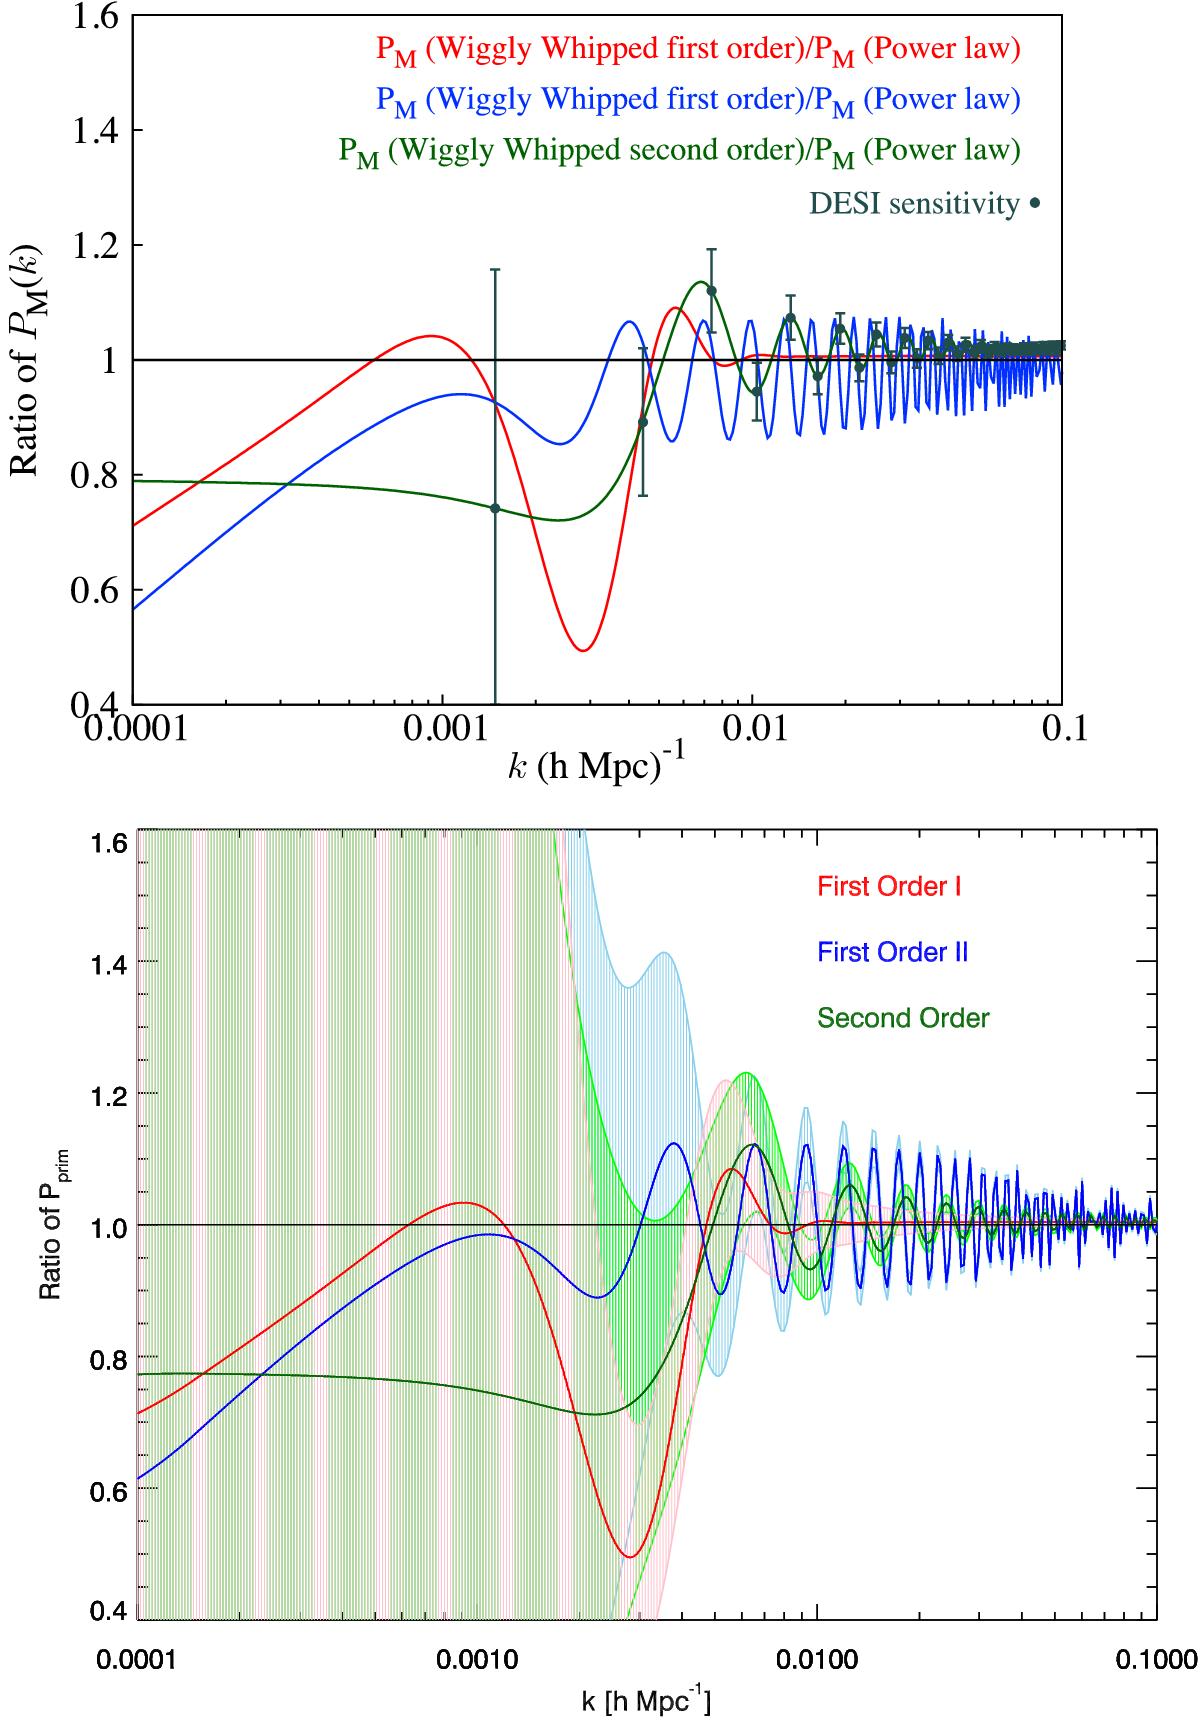
Example of the type of large-scale primordial perturbations expected for large field inflation affected by the GUT transition or other features. These example have the generic features of “just enough” Inflation (50–60 e-folds). The three curves are three versions of Wiggly Whipped Inflation (Hazra et al. 2014), best fit to CMB data: first-order version I (red), first-order version II (blue), and second order (green). The latter is the particular model used in the previous plots. The top panel shows the error bars for DESI (private communication from Pat McDonald) on the second-order Wiggly Whipped Inflation model. The lower panel shows the same inflation models, with the associated error bands (for all three curves) for an idealised FAST 2 survey extended to four years (survey 2c), with the sky coverage doubled. Note that 21 cm intensity mapping on large scales is an ideal efficient method to obtain high-quality data in this region.
Current usage metrics show cumulative count of Article Views (full-text article views including HTML views, PDF and ePub downloads, according to the available data) and Abstracts Views on Vision4Press platform.
Data correspond to usage on the plateform after 2015. The current usage metrics is available 48-96 hours after online publication and is updated daily on week days.
Initial download of the metrics may take a while.