Free Access
Fig. 6
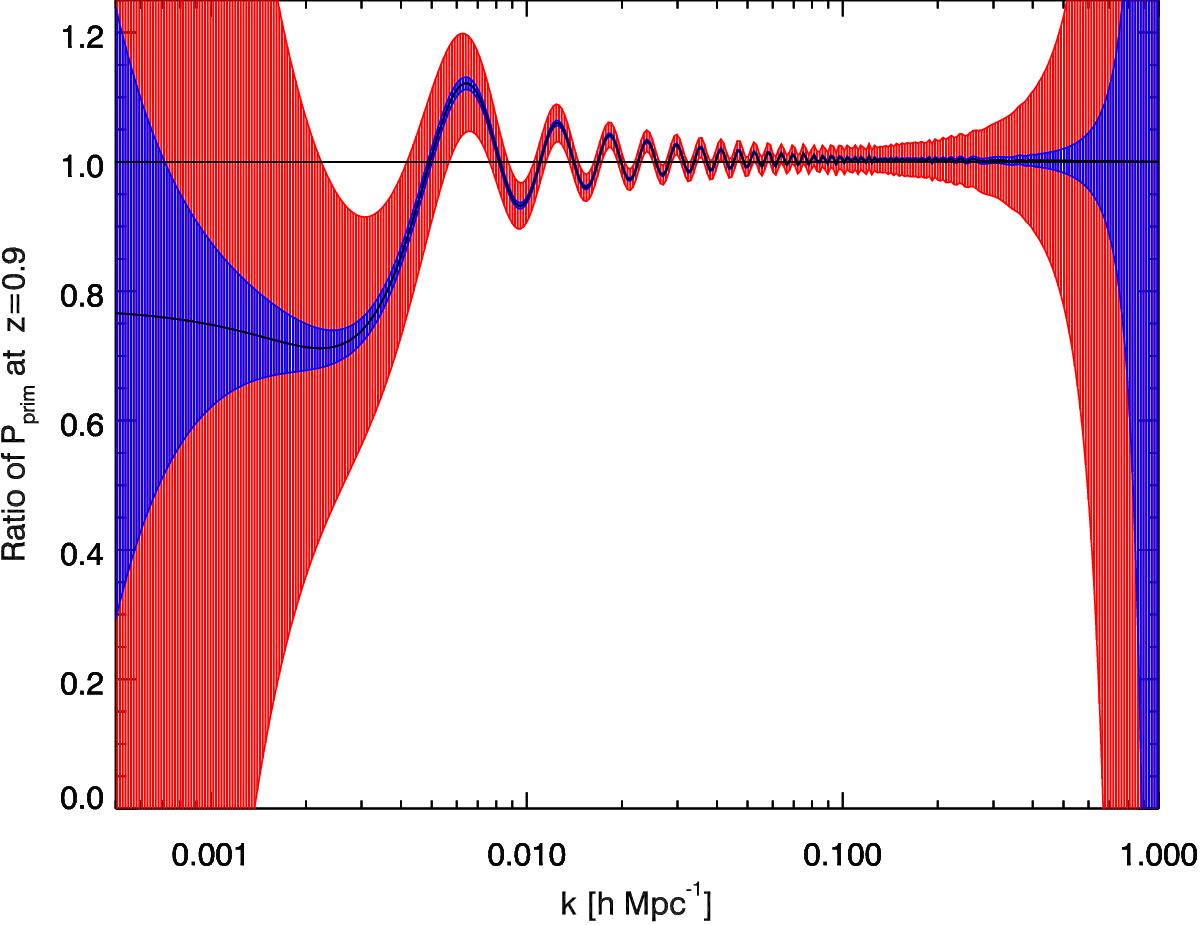
Large-scale perturbation power spectrum with error bars for survey 2, the 3D 21 cm intensity map. There are two sets of error contours. The large ones (red) are for a 48-day survey. The inner smaller errors (blue) are for an effective two-year survey.
Current usage metrics show cumulative count of Article Views (full-text article views including HTML views, PDF and ePub downloads, according to the available data) and Abstracts Views on Vision4Press platform.
Data correspond to usage on the plateform after 2015. The current usage metrics is available 48-96 hours after online publication and is updated daily on week days.
Initial download of the metrics may take a while.