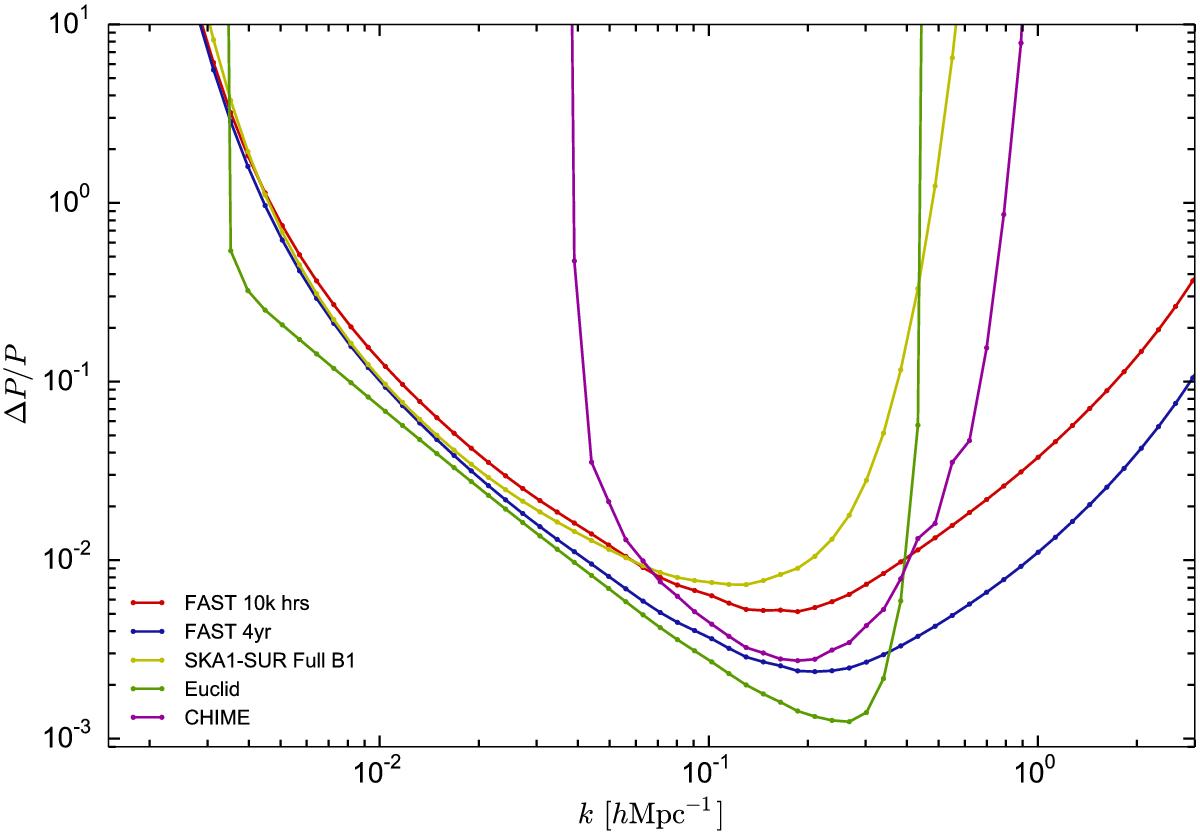
Fig. 4

Yet another comparison of surveys, all with sky coverage of about 25 000 square degrees. The plot shows the fractional error in the power spectrum versus wave number k and shows that the FAST and SKA1 survey (phase 1 of the SKA) are more directly comparable. SKA1-MID will carry out an intensity mapping survey, but SKA1-SUR is no longer planned (Santos et al. 2015; Bull 2016). The curve labelled Euclid effectively represents cosmic variance-limited observations over a similar redshift range. The survey has the same specifications as the DETF IV survey shown in the previous plots. This shows that the two programmes can approach cosmic variance limits in the central k range but begin to suffer from limitations in the signal-to-noise ratio at low k < 10-2h Mpc-1 and k > 0.2 h Mpc-1 This plot was provided by Philip Bull (priv. comm.). It follows the method used in Bull et al. (2015). All surveys use the same binning scheme: 20 bins per k-decade. 20 feeds are assumed for the two FAST surveys. The redshift ranges are as follows: the two FAST surveys (0.42 to 2.55), SKA1-SUR (0.58 to 2.55), Euclid (0.65 to 2.05), and CHIME (0.77 to 2.55). The CHIME sensitivity shown in Figs. 2 and 3 is calculated using a different technique to the one used here.
Current usage metrics show cumulative count of Article Views (full-text article views including HTML views, PDF and ePub downloads, according to the available data) and Abstracts Views on Vision4Press platform.
Data correspond to usage on the plateform after 2015. The current usage metrics is available 48-96 hours after online publication and is updated daily on week days.
Initial download of the metrics may take a while.


