Fig. 8
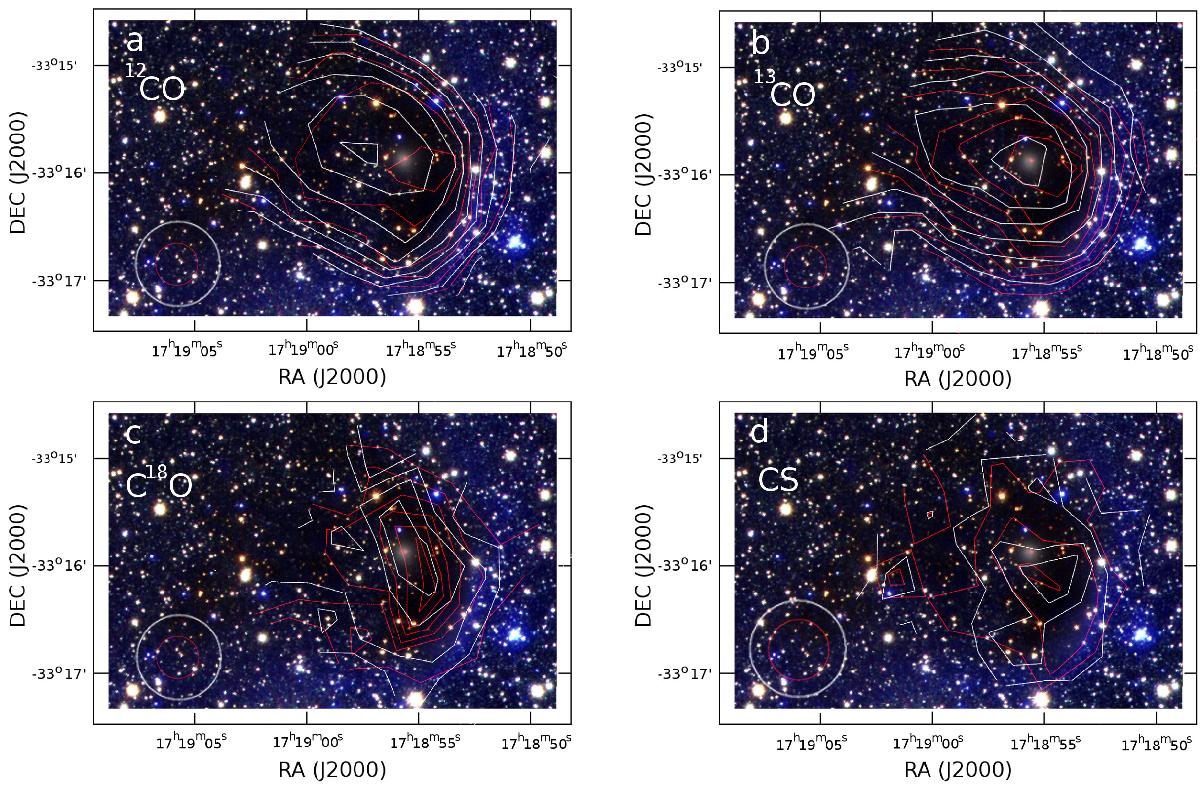
Contours of the line integrals of the observed molecular transitions(only component C3) overlayed on a VVV, Hα and WISEfalse colour image. The respective beam sizes for each molecule are shown in the lower left of each panel. a) ![]() (1−0) (in white) and (2−1) (in red) contours.Lowest contour level and increment in
(1−0) (in white) and (2−1) (in red) contours.Lowest contour level and increment in ![]() scale is 2 K km s-1. b) As a but for
scale is 2 K km s-1. b) As a but for ![]() .Lowest contour level and increment are 1 K km s-1 for
.Lowest contour level and increment are 1 K km s-1 for ![]() (1−0) and 0.5 K km s-1 for
(1−0) and 0.5 K km s-1 for ![]() (2−1). c) As a for C18O.Lowest contour level and increment 0.2 K km s-1, and d) as a for CS (2−1) (in white) and CS (3–2) in red.Lowest contours and increments are 0.2 K km s-1 for CS (2−1) and 0.1 K km s-1 for CS (3–2).
(2−1). c) As a for C18O.Lowest contour level and increment 0.2 K km s-1, and d) as a for CS (2−1) (in white) and CS (3–2) in red.Lowest contours and increments are 0.2 K km s-1 for CS (2−1) and 0.1 K km s-1 for CS (3–2).
Current usage metrics show cumulative count of Article Views (full-text article views including HTML views, PDF and ePub downloads, according to the available data) and Abstracts Views on Vision4Press platform.
Data correspond to usage on the plateform after 2015. The current usage metrics is available 48-96 hours after online publication and is updated daily on week days.
Initial download of the metrics may take a while.