Free Access
Fig. 7
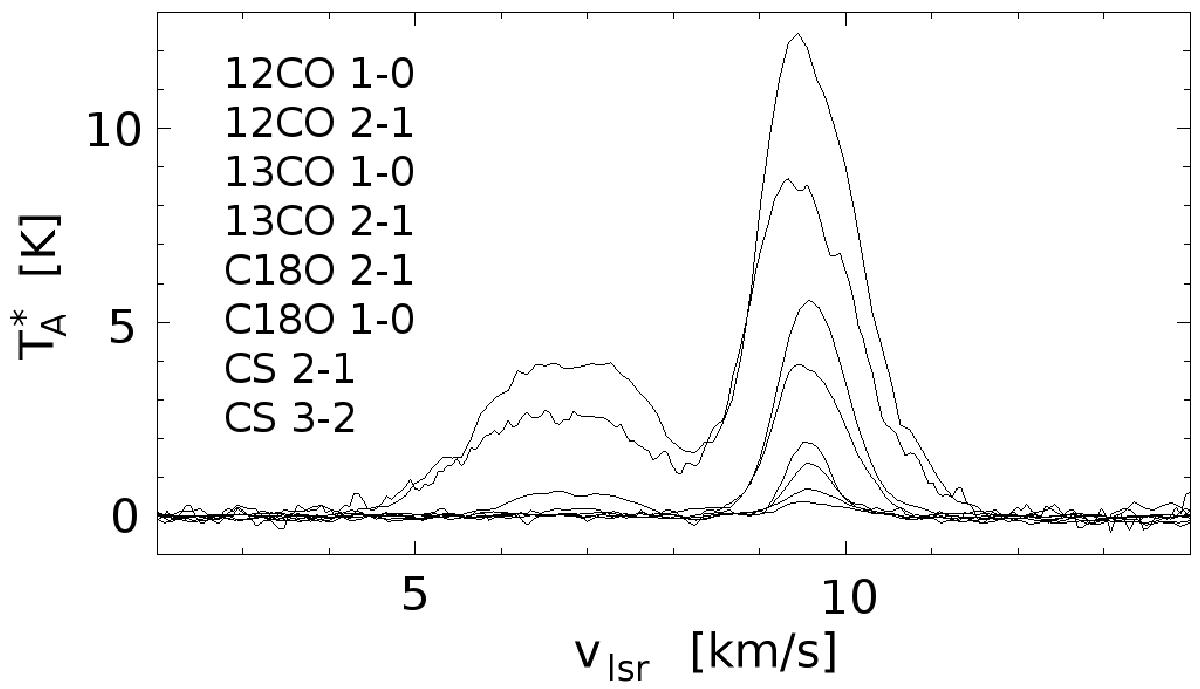
Observed CO and CS lines at the map off-set position +17′′, 10′′. Only the two strongest line components, C2 and C3, are shownThe lines are identified on the left in the order of the intensity of the C3 component.
Current usage metrics show cumulative count of Article Views (full-text article views including HTML views, PDF and ePub downloads, according to the available data) and Abstracts Views on Vision4Press platform.
Data correspond to usage on the plateform after 2015. The current usage metrics is available 48-96 hours after online publication and is updated daily on week days.
Initial download of the metrics may take a while.