Free Access
Fig. B.8
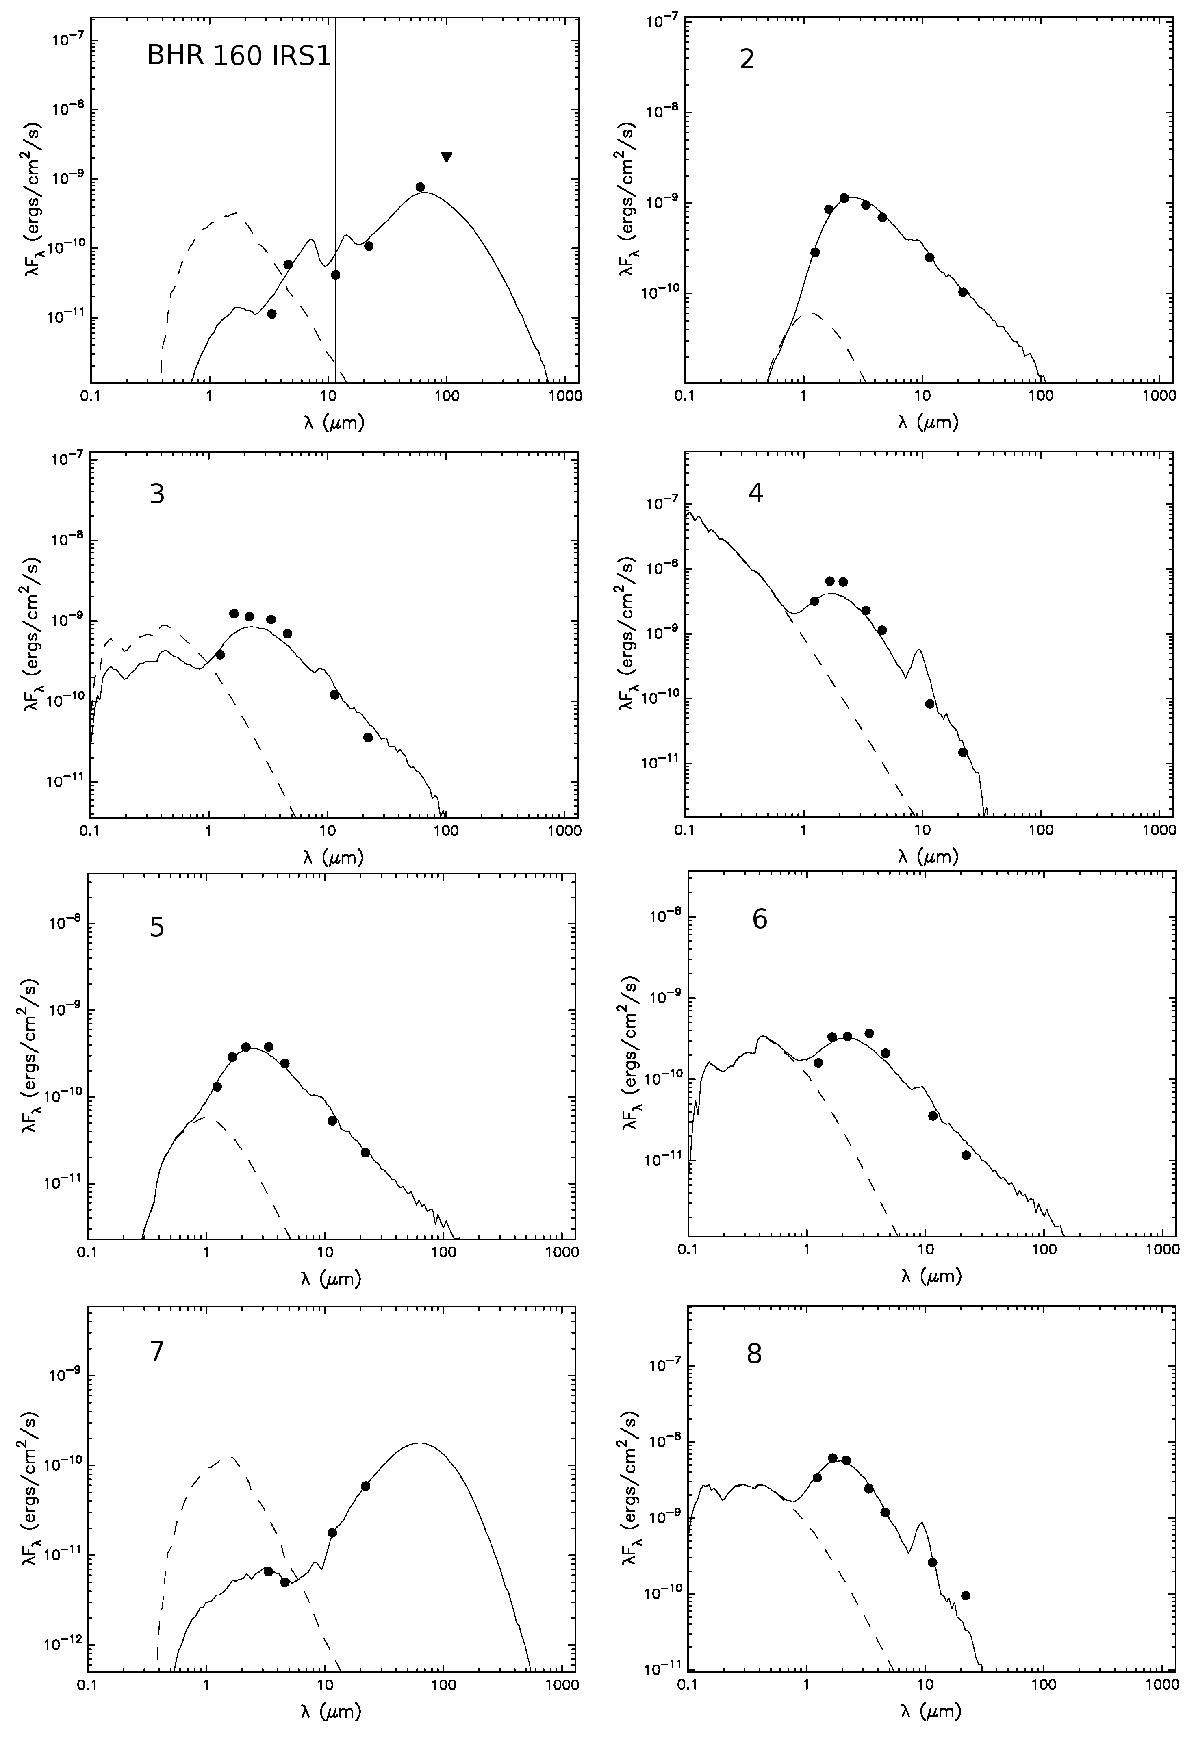
SED fits for the marked objects in Fig. 4. The filled circles are the observed fluxes and the triangle marks the BHR 160 IRS1 IRAS 100 μm flux upper limit. The dashed line indicates the SED of theunreddened stellar photosphere.
Current usage metrics show cumulative count of Article Views (full-text article views including HTML views, PDF and ePub downloads, according to the available data) and Abstracts Views on Vision4Press platform.
Data correspond to usage on the plateform after 2015. The current usage metrics is available 48-96 hours after online publication and is updated daily on week days.
Initial download of the metrics may take a while.