Free Access
Fig. B.1
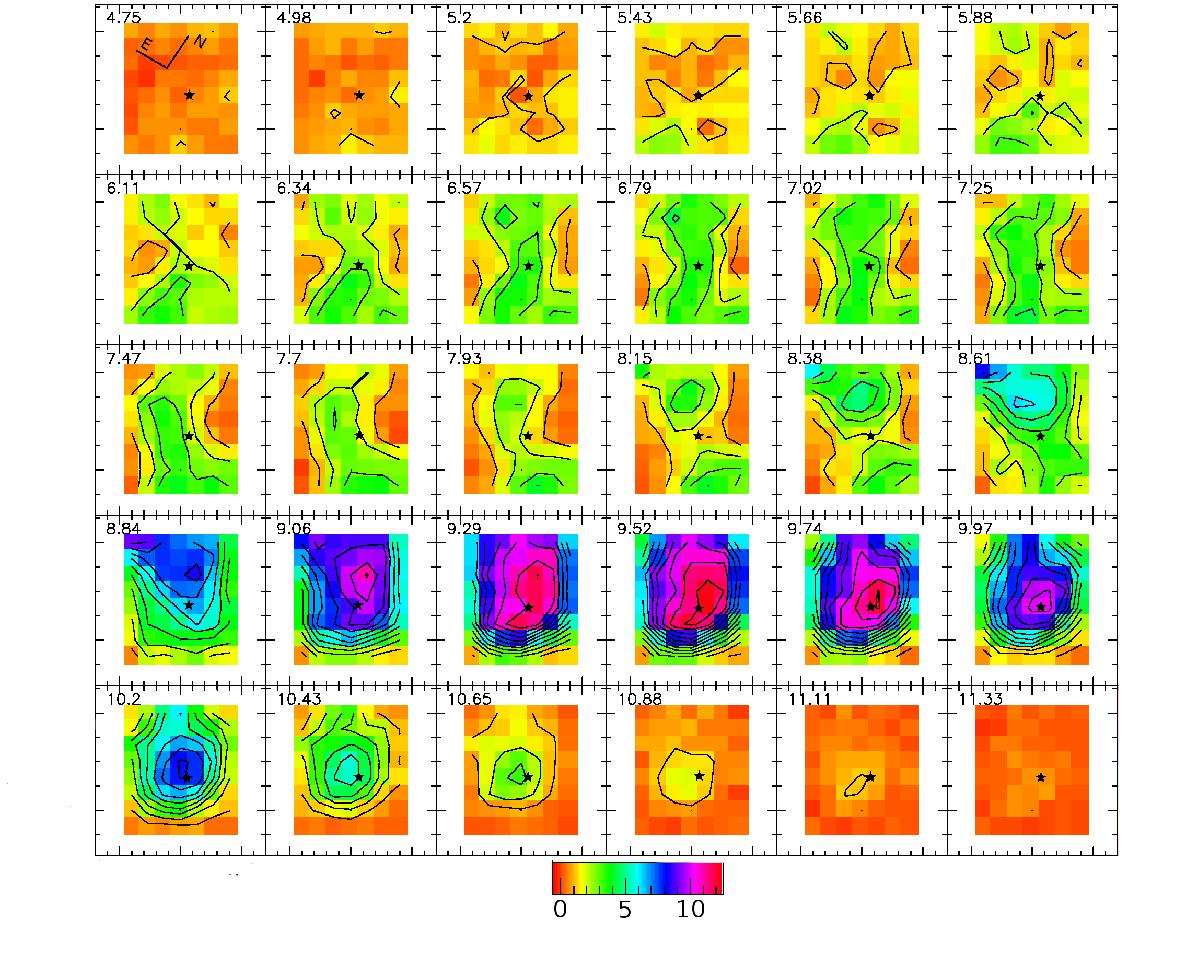
Channel map of CO (1−0) line emission in velocity bins of 0.23 km s-1. Pixel scale is 20′′ by 20′′ and the north-east orientation is indicated in the upper left panel. The position of BHR 160 IRS1 is indicated by an asterisk in each panel. The lowest contour level and increment are 1.0 K km s-1.
Current usage metrics show cumulative count of Article Views (full-text article views including HTML views, PDF and ePub downloads, according to the available data) and Abstracts Views on Vision4Press platform.
Data correspond to usage on the plateform after 2015. The current usage metrics is available 48-96 hours after online publication and is updated daily on week days.
Initial download of the metrics may take a while.