Fig. 7
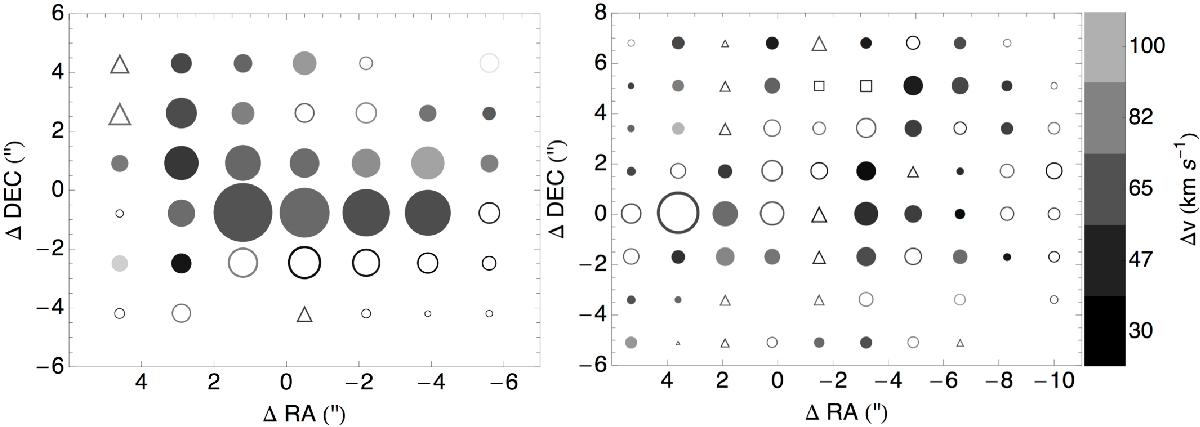
Map of the locations of the different velocity profiles in the south (left) and north (right) where spectra are fit with single (open circle), double (filled circle), triple (triangle), or more (square) components (see for comparison Fig. 2). The size of the symbol is scaled to the integrated CO intensity, while the gray scaling indicates the effective velocity width of the profile shown by the scale bar to the right (estimated by summing the ΔV measured for each individual component in quadrature). The same scaling is adopted for the northern and southern bar ends.
Current usage metrics show cumulative count of Article Views (full-text article views including HTML views, PDF and ePub downloads, according to the available data) and Abstracts Views on Vision4Press platform.
Data correspond to usage on the plateform after 2015. The current usage metrics is available 48-96 hours after online publication and is updated daily on week days.
Initial download of the metrics may take a while.