Fig. 6
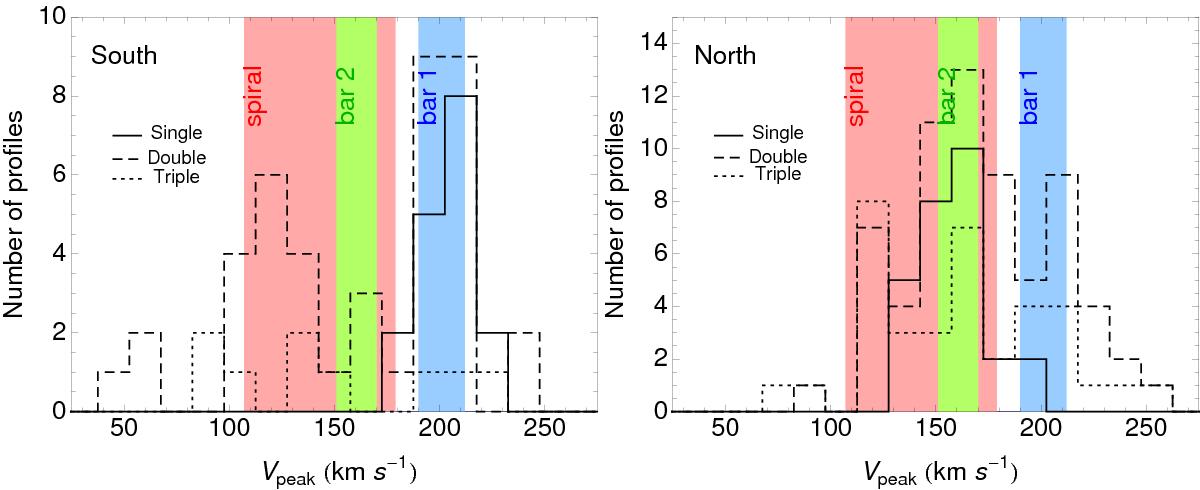
Histograms of the centroid velocity of each fitted component extracted in the north (right) and south (left). The line style indicates the number of velocity components fitted along each line of sight: single (solid), double (dashed), and triple or more (dotted). The centroid velocity is shown transformed into the galaxy-plane as in Fig. 5. Overlaid colored rectangles show the predictions of the model for the spiral, the bar in scenario 1, and the bar in scenario 2 as in Fig. 5.
Current usage metrics show cumulative count of Article Views (full-text article views including HTML views, PDF and ePub downloads, according to the available data) and Abstracts Views on Vision4Press platform.
Data correspond to usage on the plateform after 2015. The current usage metrics is available 48-96 hours after online publication and is updated daily on week days.
Initial download of the metrics may take a while.