Fig. 5
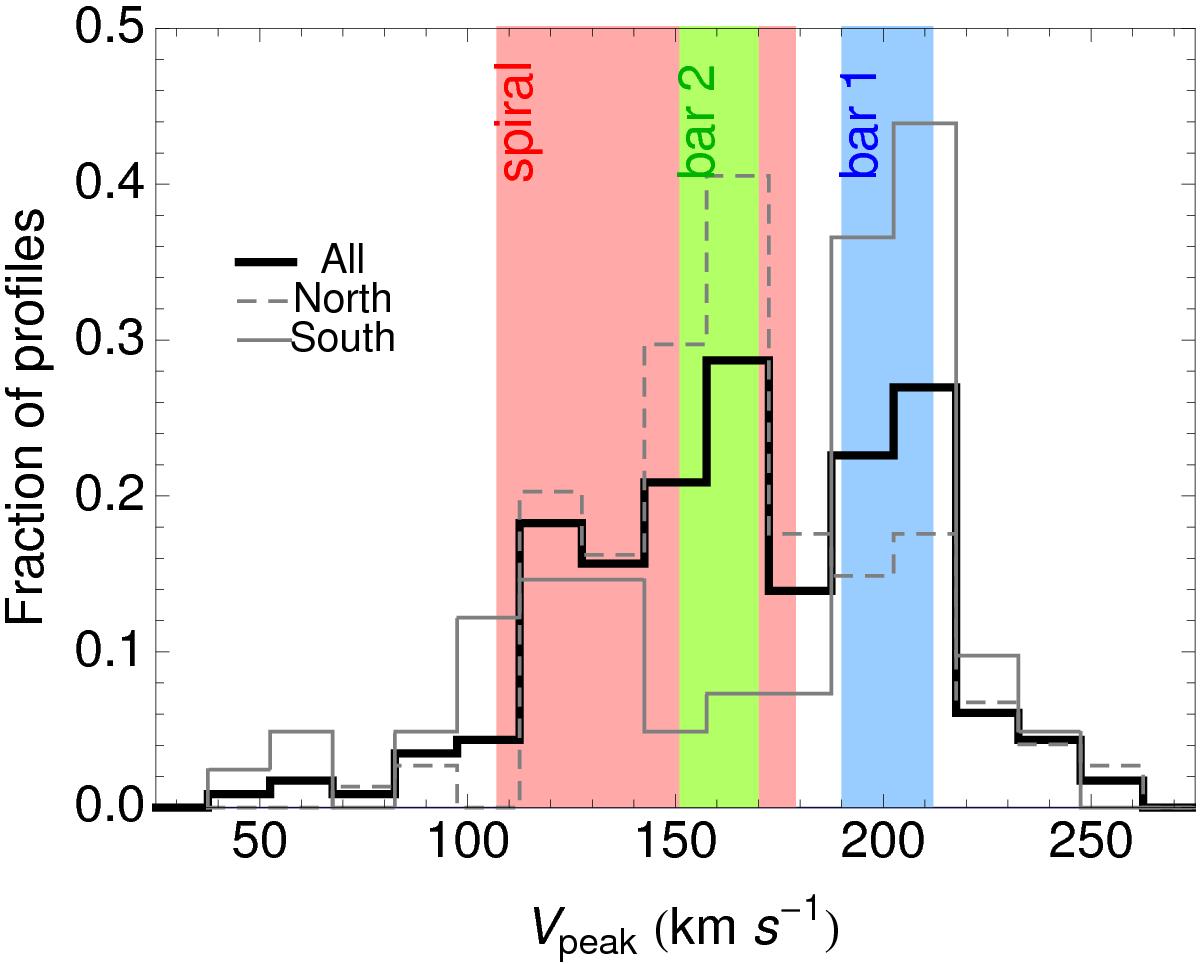
Histogram showing the relative frequency of the centroid velocities of all fitted velocity components (PdBI+30 m CO(2−1) data). Velocities measured in the north and south are shown as gray dashed and solid lines, respectively, while the solid black line takes all components into consideration. The centroid velocity is shown transformed into the galaxy-plane (Eq. (1)). Overlaid rectangles represent the different predictions of the models described in Sect. 4. Two predictions for the bar are shown: the blue rectangle shows ![]() in Eq. (3) from scenario 1, in which the bar has a higher pattern speed than the spiral Ωb> Ωs, while the green rectangle shows
in Eq. (3) from scenario 1, in which the bar has a higher pattern speed than the spiral Ωb> Ωs, while the green rectangle shows ![]() in Eq. (6) from scenario 2, in which the bar and spiral have the same pattern speed Ωb = Ωs. The red rectangle shows the prediction for the spiral motions corresponding to
in Eq. (6) from scenario 2, in which the bar and spiral have the same pattern speed Ωb = Ωs. The red rectangle shows the prediction for the spiral motions corresponding to ![]() in Eq. (8). Velocities spanned by the spiral illustrate a range of spiral arm strengths corresponding to Σa/ Σ0 = 0.5−1.5.
in Eq. (8). Velocities spanned by the spiral illustrate a range of spiral arm strengths corresponding to Σa/ Σ0 = 0.5−1.5.
Current usage metrics show cumulative count of Article Views (full-text article views including HTML views, PDF and ePub downloads, according to the available data) and Abstracts Views on Vision4Press platform.
Data correspond to usage on the plateform after 2015. The current usage metrics is available 48-96 hours after online publication and is updated daily on week days.
Initial download of the metrics may take a while.