Fig. 4
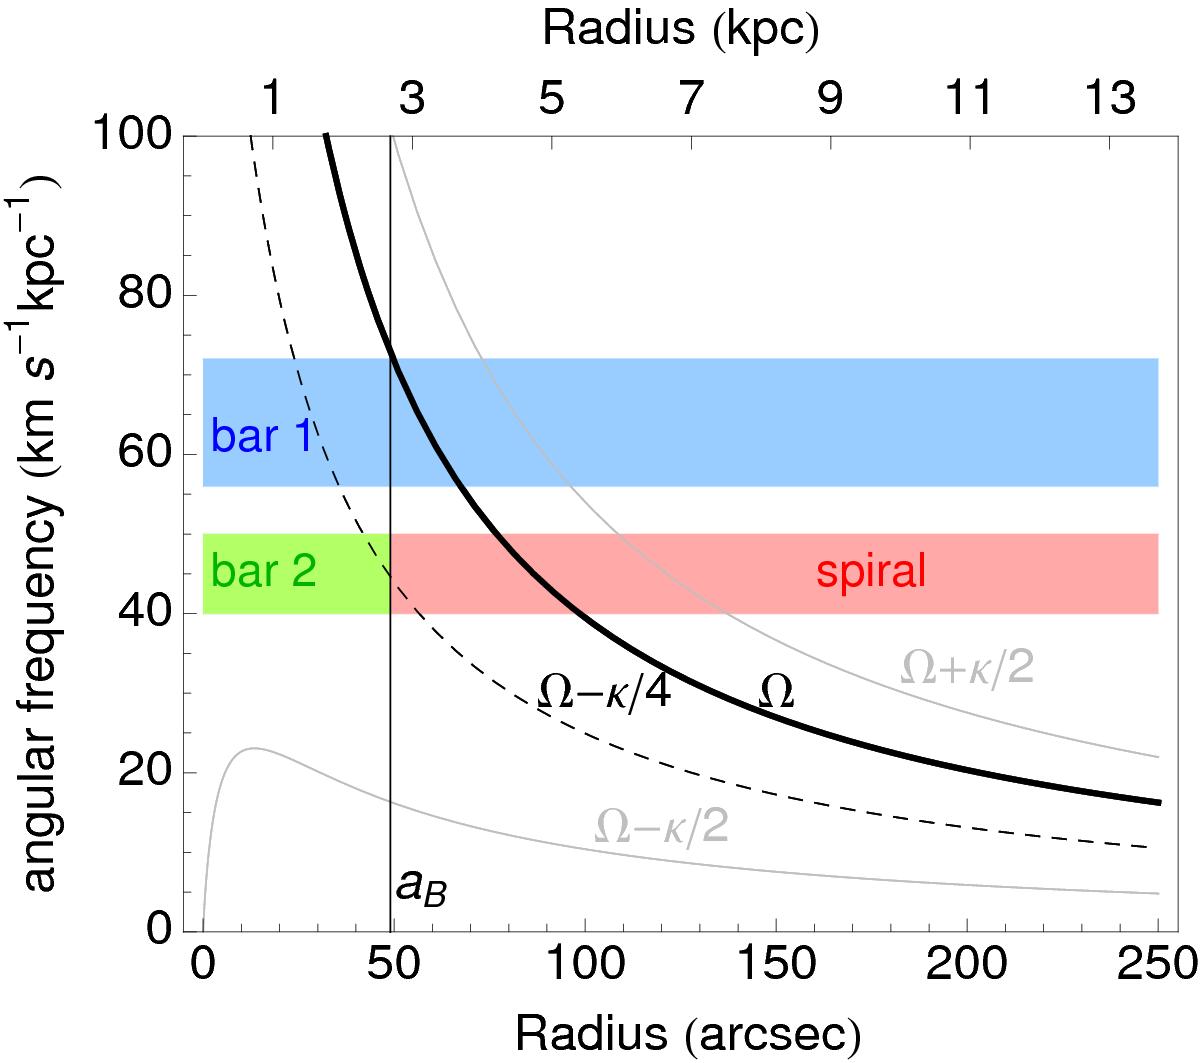
Angular frequency curves in NGC 3627: Ω (thick black), Ω ± κ/ 2 (light gray), and Ω−κ/ 4 (dashed). The vertical line marks the end of the bar (Chemin & Hernandez 2009) with length aB = 49′′. The red horizontal box shows the range in spiral speeds as measured from gas kinematics (see text). The blue horizontal box indicates the range of bar speeds in scenario 1, suggested by Chemin & Hernandez (2009), while the green box shows the bar speed in scenario 2 (same speed as the spiral). The different bar and spiral scenarios are labeled in the plot.
Current usage metrics show cumulative count of Article Views (full-text article views including HTML views, PDF and ePub downloads, according to the available data) and Abstracts Views on Vision4Press platform.
Data correspond to usage on the plateform after 2015. The current usage metrics is available 48-96 hours after online publication and is updated daily on week days.
Initial download of the metrics may take a while.