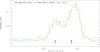
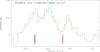
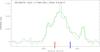
Fig. 3
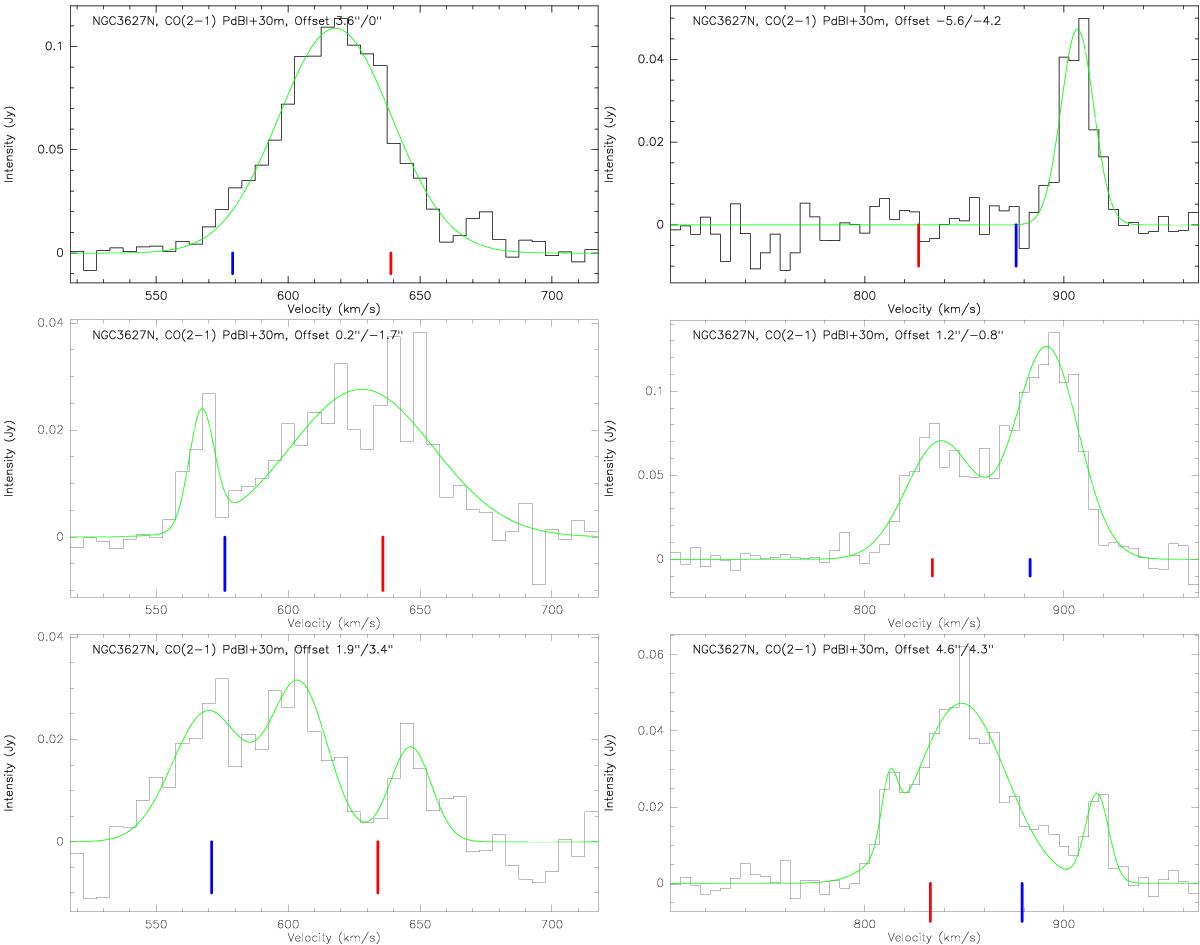
PdBI+30 m CO(2−1) example spectra toward NGC 3627N (left) and NGC 3627S (right). The offsets of the positions are marked (see also Fig. 2). The green lines present the Gaussian fits to the data. The corresponding FWHM and peak positions are reported in Tables A.1 and A.2. The blue and red lines at the bottom of each panel indicate mean values of the velocities for the bar 1 scenario and the spiral described in Sect. 4. The corresponding full velocity ranges are shown in Figs. 5 and 6.
Current usage metrics show cumulative count of Article Views (full-text article views including HTML views, PDF and ePub downloads, according to the available data) and Abstracts Views on Vision4Press platform.
Data correspond to usage on the plateform after 2015. The current usage metrics is available 48-96 hours after online publication and is updated daily on week days.
Initial download of the metrics may take a while.