Fig. 2
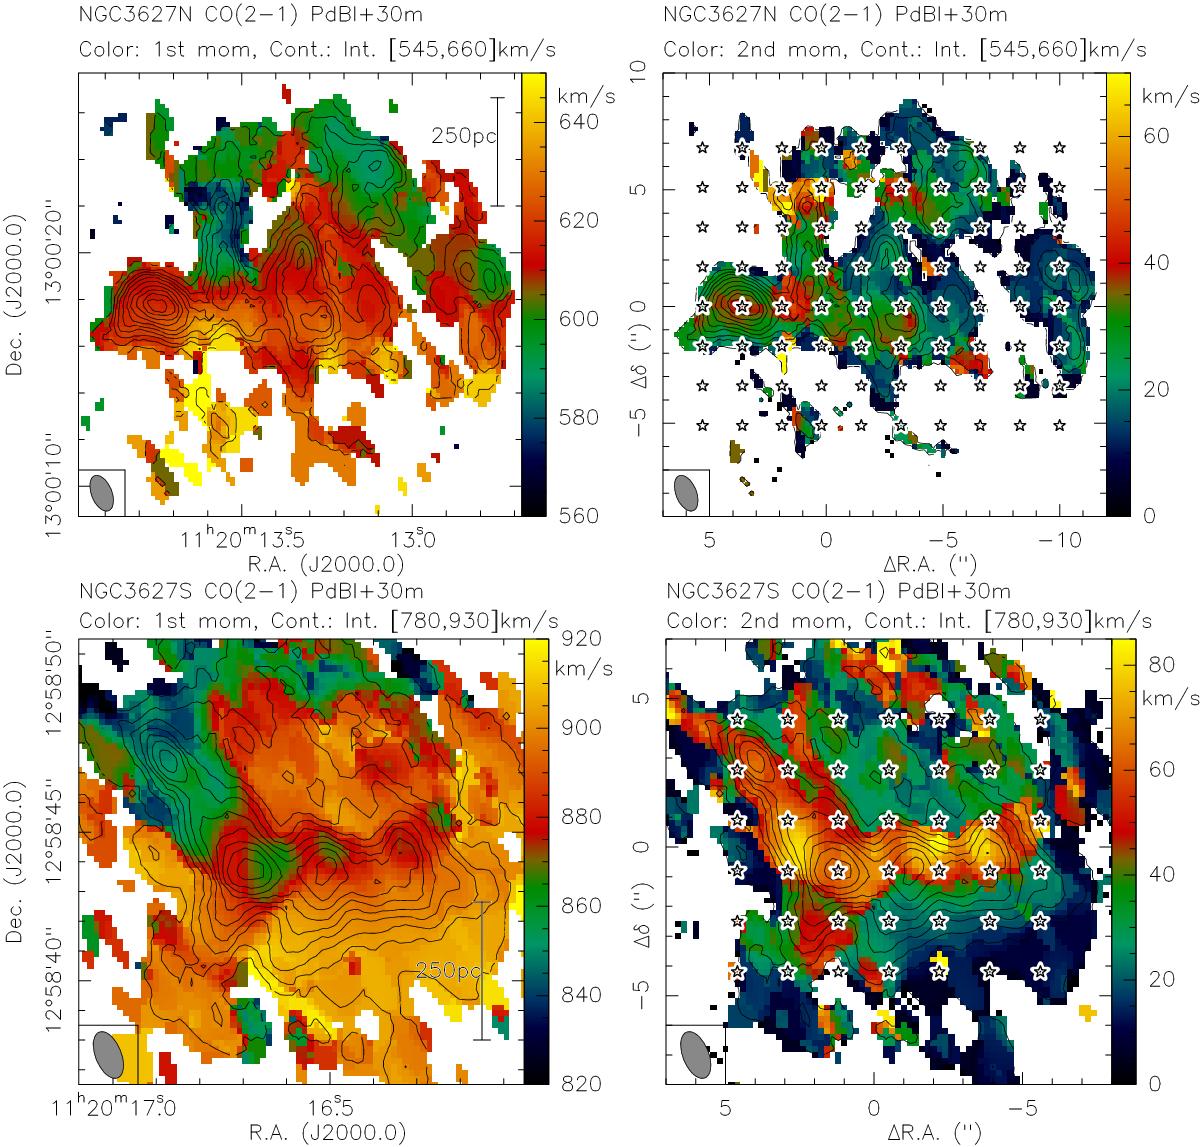
Combined PdBI+30 m CO(2−1) data toward NGC 3627 north and south (top and bottom panels, respectively). The colors show in the left and right panels the first (intensity-weighted peak velocities) and second moments (intensity-weighted line widths), respectively. The contours present the integrated intensities in the velocity regimes indicated above each panel from 5 to 95% of the peak intensities (in 10% steps). The stars in the right panels show the positions for spectrum extraction. Example spectra are shown in Fig. 3, and fit results are presented in Tables A.1 and A.2.
Current usage metrics show cumulative count of Article Views (full-text article views including HTML views, PDF and ePub downloads, according to the available data) and Abstracts Views on Vision4Press platform.
Data correspond to usage on the plateform after 2015. The current usage metrics is available 48-96 hours after online publication and is updated daily on week days.
Initial download of the metrics may take a while.