Fig. 1
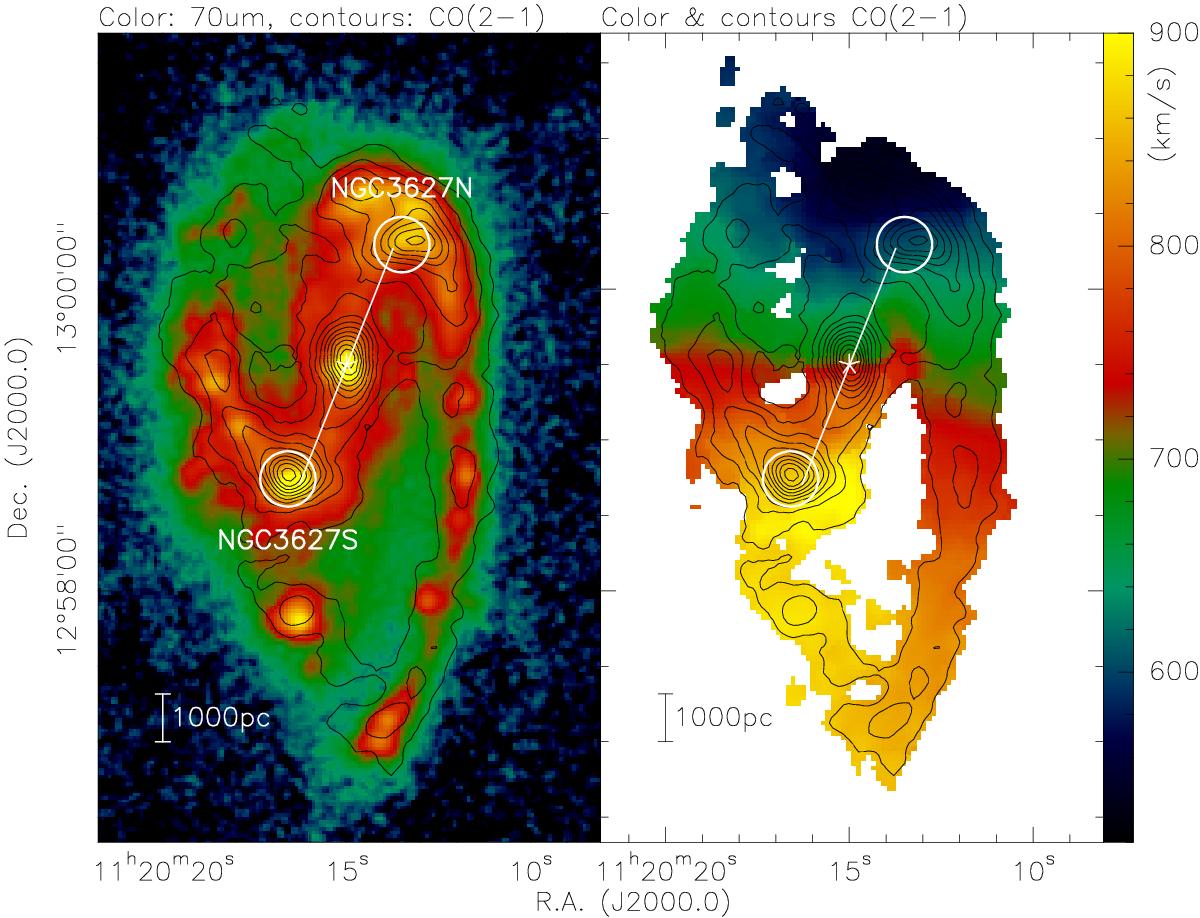
Herschel 70 μm (Kennicutt et al. 2011) and HERACLES CO(2–1) data of NGC 3627 (Leroy et al. 2009). The left panel presents in color the 70 μm emission (logarithmic stretch from 0.0001 to 0.1 Jy pixel-1), while the contours shows the integrated CO(2–1) emission from 5 to 55 K km s-1 in 5 K km s-1 steps. In the right panel, the color scale presents the first moment map (intensity-weighted velocities), the contours again show the integrated CO(2–1) emission. Circles mark the locations and areas of the PdBI(2−1) primary beams for NGC 3627N and NGC 3627S. The central star and white line indicate the bar location following Casasola et al. (2011). A linear scale bar assuming 11.1 Mpc distance is shown in the bottom left corner.
Current usage metrics show cumulative count of Article Views (full-text article views including HTML views, PDF and ePub downloads, according to the available data) and Abstracts Views on Vision4Press platform.
Data correspond to usage on the plateform after 2015. The current usage metrics is available 48-96 hours after online publication and is updated daily on week days.
Initial download of the metrics may take a while.