Fig. 8
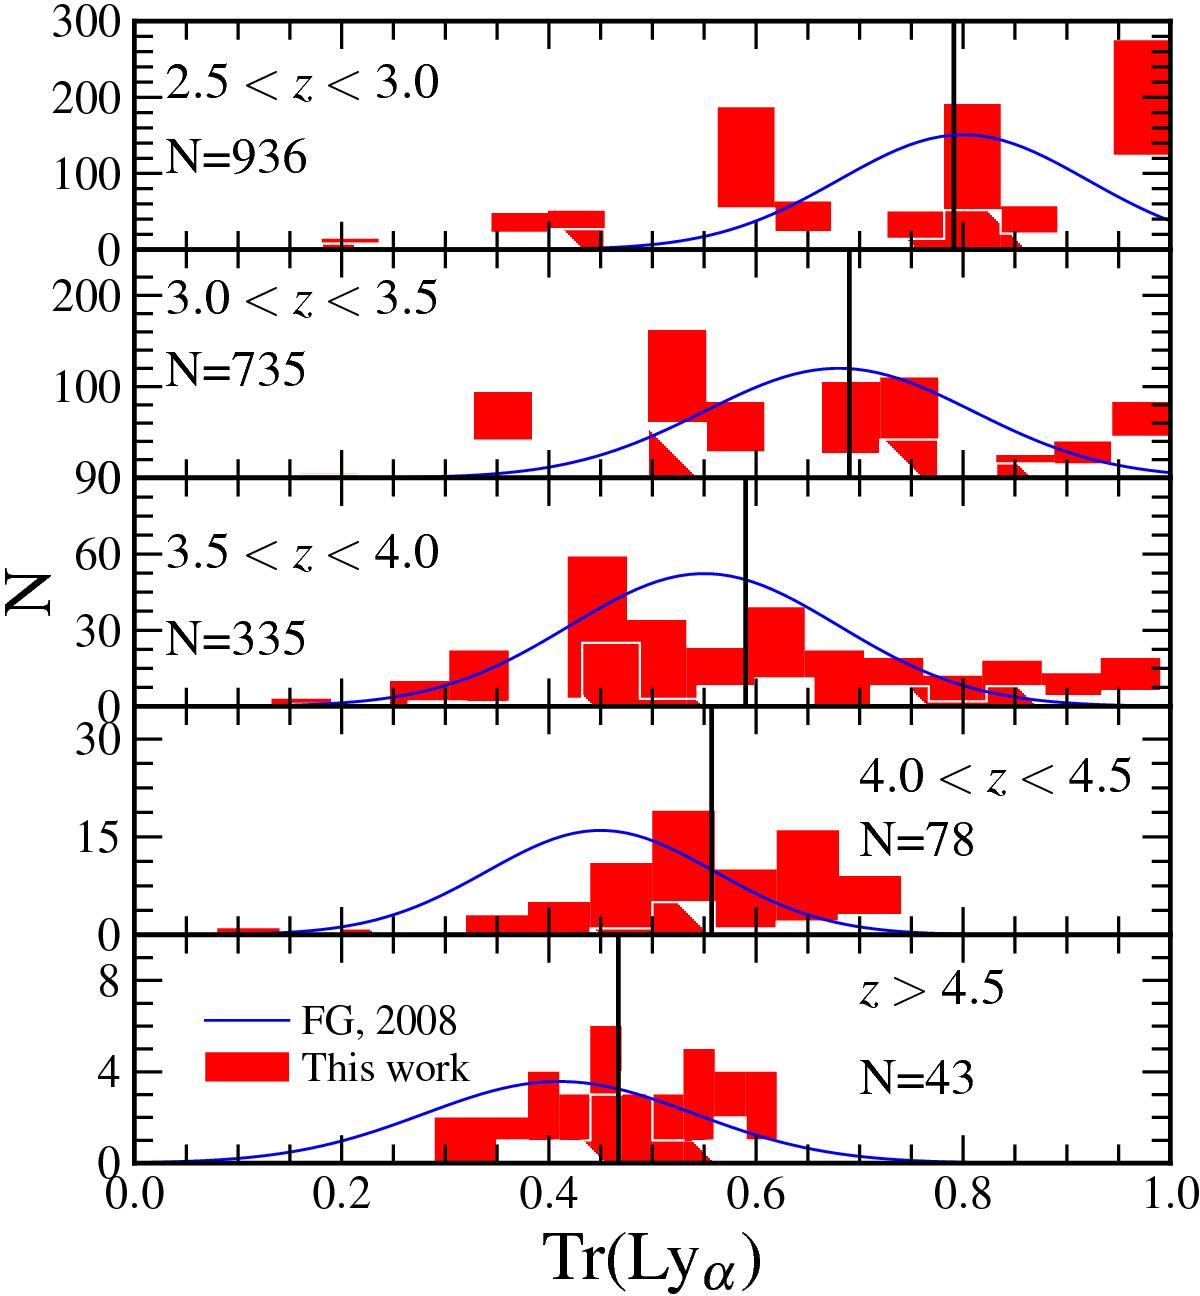
IGM transmission Tr(Lyα) measured from 2127 VUDS galaxies in increasing redshift bins from z = 2.5 to z = 5.5. The black vertical lines represent the median of the distributions in each redshift bin. A wide spread in transmission is observed at all redshifts. The red shaded histograms include all galaxies with flags 2, 3, and 4, while the white striped histograms only represent flag 2. No significant difference is found between the IGM properties of flags 3 and 4 and flag 2. The distribution of IGM transmission is somewhat discretized because of the seven IGM templates used in the spectral fitting. The median and dispersion values measured by Faucher-Giguère et al. (2008b) using QSOs are represented by the blue distribution in each redshift bin. The median values from VUDS galaxies are in excellent agreement with Faucher-Giguère et al. (2008b) for z < 4, while the VUDS results seem to show higher transmission at z > 4 (see text for a discussion). The dispersion values are also in excellent agreement at all redshifts.
Current usage metrics show cumulative count of Article Views (full-text article views including HTML views, PDF and ePub downloads, according to the available data) and Abstracts Views on Vision4Press platform.
Data correspond to usage on the plateform after 2015. The current usage metrics is available 48-96 hours after online publication and is updated daily on week days.
Initial download of the metrics may take a while.