Fig. 5
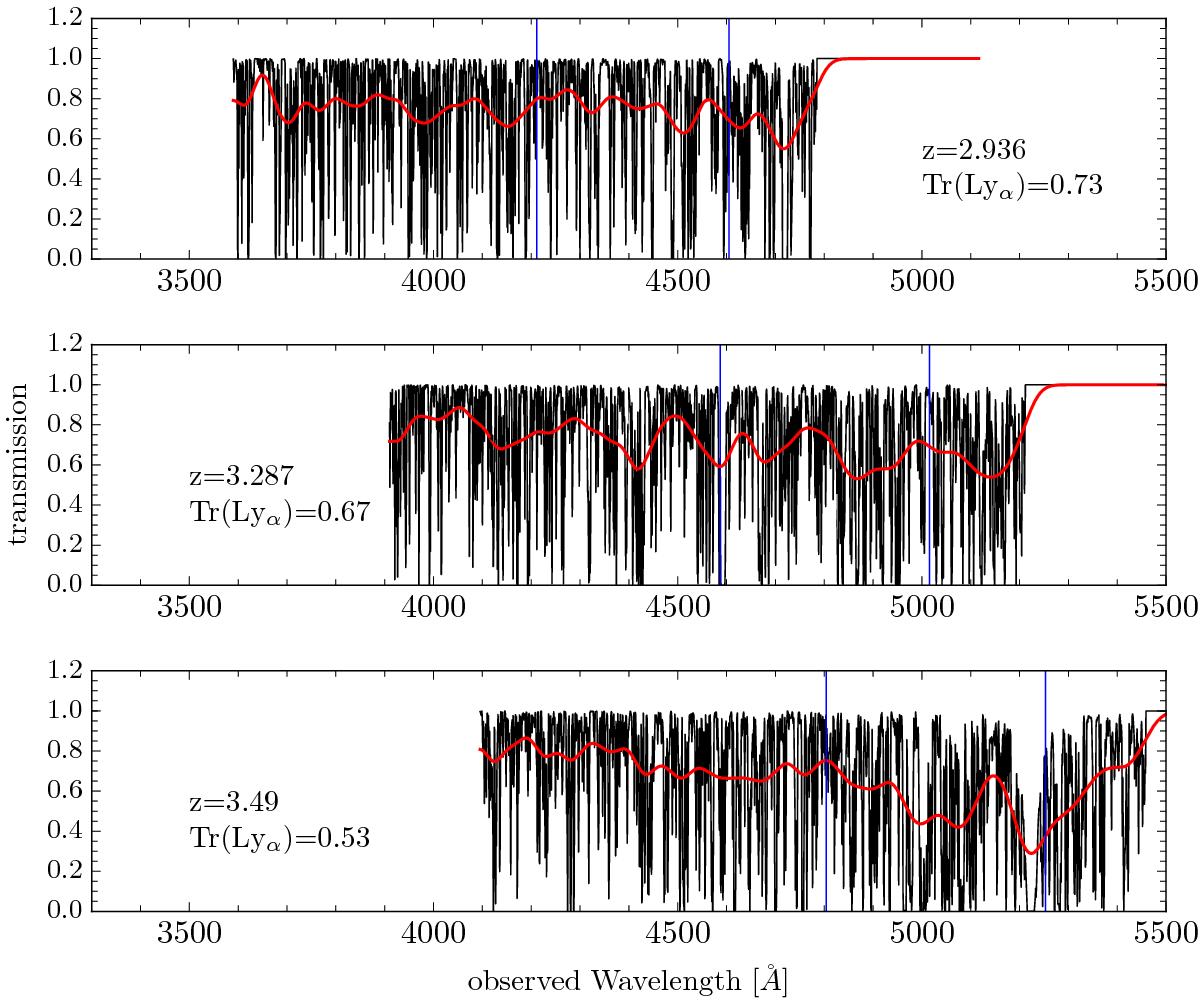
Three examples of Lyα skewers at z = 2.936, z = 3.287, and z = 3.49. In each plot, the black spectrum represents the high spectral resolution BOSS DR11 mock IGM transmission, while the same spectrum in red is degraded to the VUDS lower resolution. The blue lines in each panel represent the wavelength interval where the Lyα transmission is estimated (1070−1170 Å).
Current usage metrics show cumulative count of Article Views (full-text article views including HTML views, PDF and ePub downloads, according to the available data) and Abstracts Views on Vision4Press platform.
Data correspond to usage on the plateform after 2015. The current usage metrics is available 48-96 hours after online publication and is updated daily on week days.
Initial download of the metrics may take a while.