Fig. 16
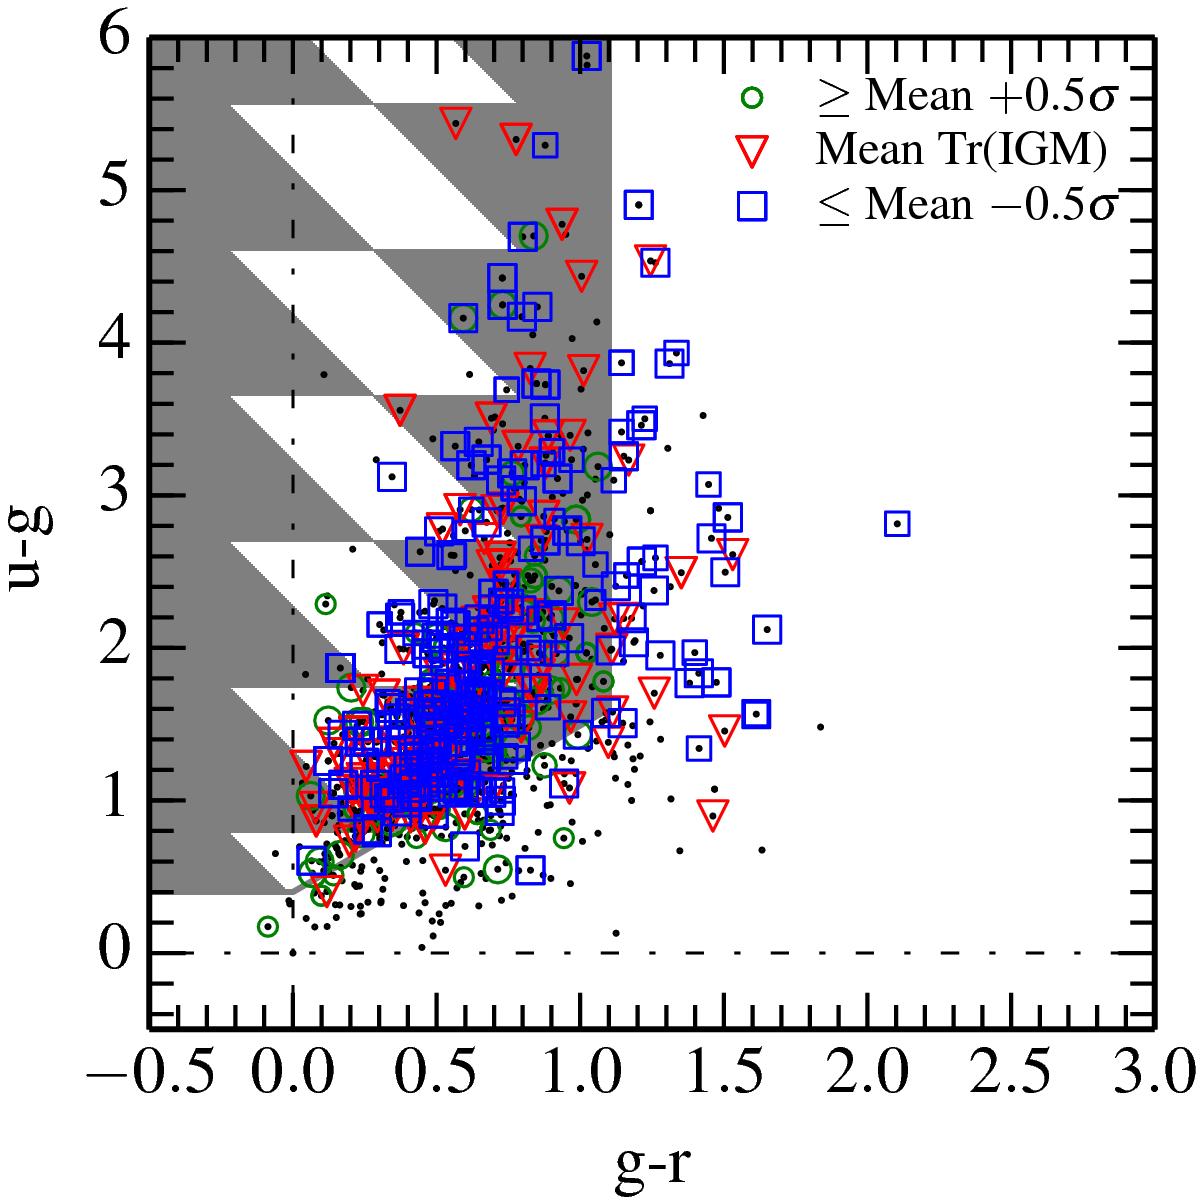
(u−g,g−r) colour−colour diagram for VUDS galaxies used in this study. The points are colour-coded based on the IGM transmission measured from the spectral fitting for each of them. The red points are the galaxies for which GOSSIP+ identified an IGM equal to the mean M06 model. The blue points are the objects for which the IGM transmission is −0.5, −1.0, or −1.5σ below the mean, and green points are for +0.5, +1.0, or +1.5σ above the mean. The galaxies outside the box have an IGM transmission below the mean M06 IGM transmission. Black points represent the whole VUDS sample at 2.7 < z < 3.5.
Current usage metrics show cumulative count of Article Views (full-text article views including HTML views, PDF and ePub downloads, according to the available data) and Abstracts Views on Vision4Press platform.
Data correspond to usage on the plateform after 2015. The current usage metrics is available 48-96 hours after online publication and is updated daily on week days.
Initial download of the metrics may take a while.