Fig. 14
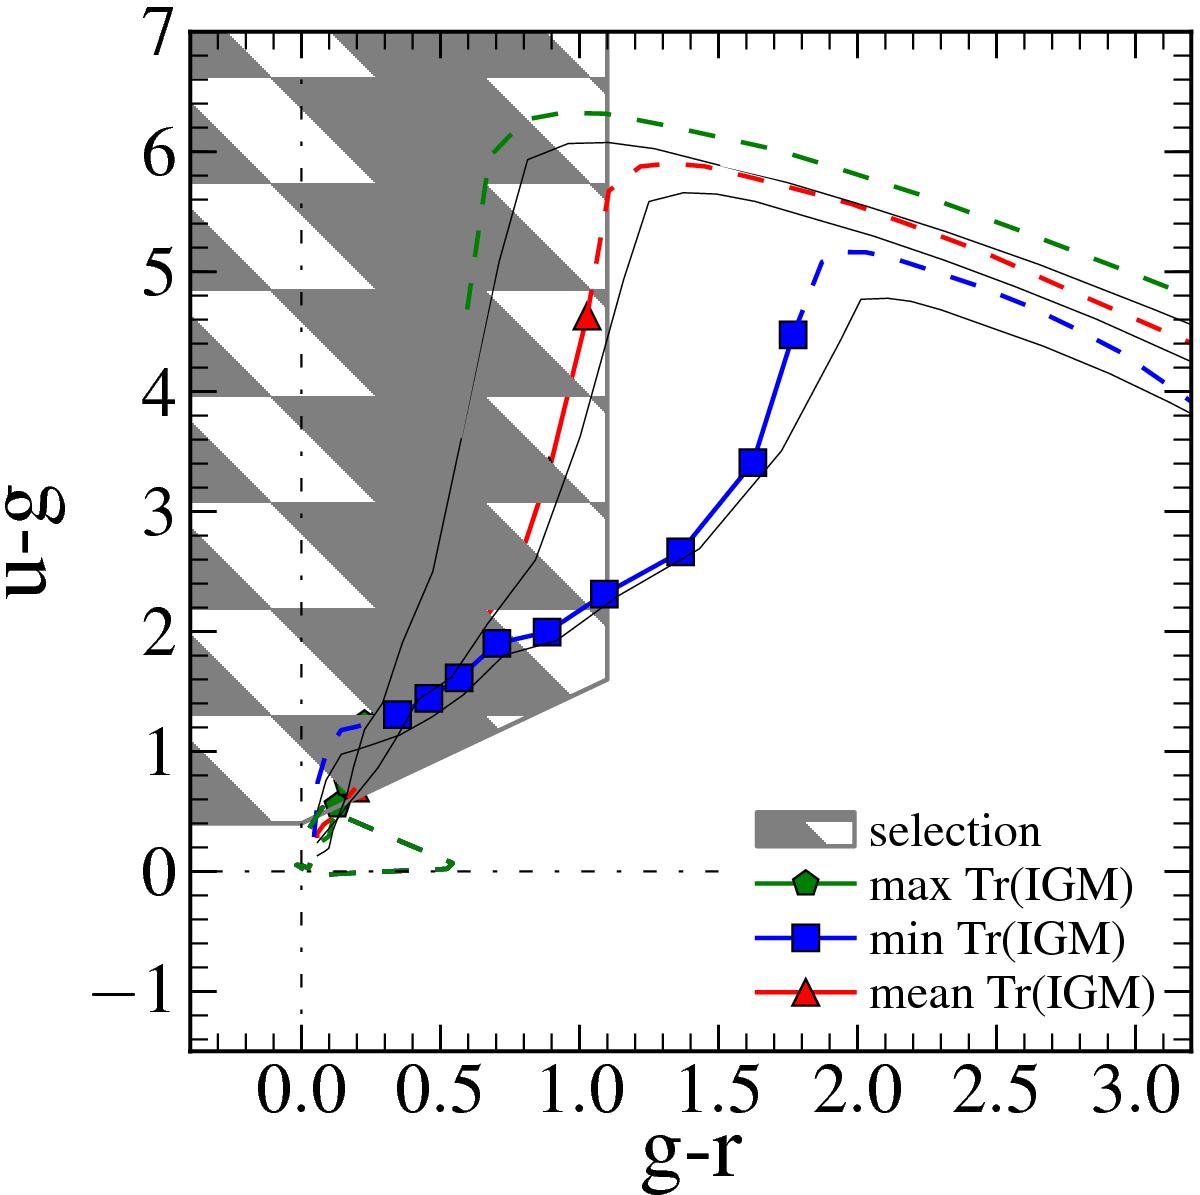
Effect of the change in IGM transmission on the colour−colour (u−g,g−r) tracks of a galaxy with 2.5 < z < 3.5 and its selection. As an example we use a template galaxy with average properties at this redshift: 0.4 Gyr old, with E(B−V) = 0.1, a metallicity of Z⊙/ 2.5, and an SFH timescale of 0.3 Gyr. The blue curve represents the (u−g,g−r) track for a low IGM transmission (mean −1.0σ), while the green curve represents the track computed with a high IGM transmission (mean +1.0σ). The red track is computed with the mean IGM transmission from M06. The grey dashed box corresponds to the LBG selection for this filter set (from Le Fèvre et al. 2013b). For each of the high- or low-transmission tracks the full line with squares (displayed at steps of Δz = 0.1) ranges from z = 2.7 to z = 3.5, while the dashed line is for z < 2.7 and z > 3.5. We use an apparent (observed) flux below the Lyman limit of 3% of the flux at 1500 Å as measured by Le Fèvre et al (2014) in the VUDS survey (see also Cooke et al. 2014). The black lines are the corresponding tracks computed with the M95 models.
Current usage metrics show cumulative count of Article Views (full-text article views including HTML views, PDF and ePub downloads, according to the available data) and Abstracts Views on Vision4Press platform.
Data correspond to usage on the plateform after 2015. The current usage metrics is available 48-96 hours after online publication and is updated daily on week days.
Initial download of the metrics may take a while.