Fig. 11

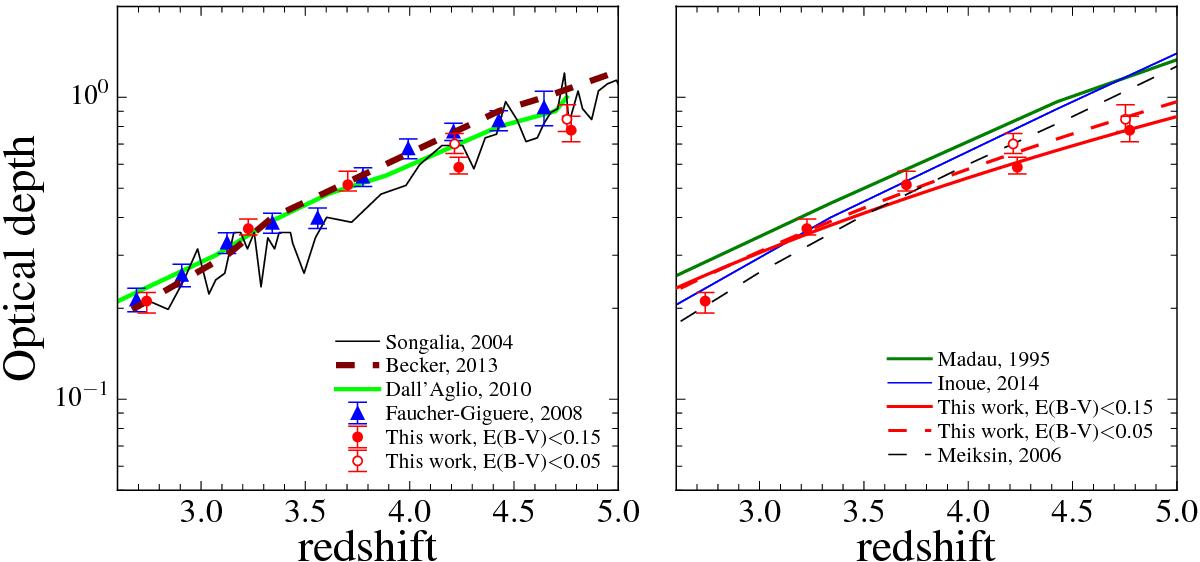
Left panel: the HI optical depth τeff as computed from the measured IGM transmission in the VUDS galaxy data (red filled circles for E(B−V) ≤ 0.15 and empty red circles for E(B−V) ≤ 0.05). The error bars on τeff represent the error on the mean (defined as ![]() ) on the 2127 LOS probed by the VUDS galaxies. The data of Songaila (2004) are indicated by the black line, and the brown line represents the measurements from Becker (2013). The blue triangles are from Faucher-Giguère et al. (2008a) and the green line indicates the measurement of Dall’Aglio et al. (2008). Right panel: power-law fit of the VUDS HI optical depth τeff as a function of redshift, with τeff = C(1 + z)γ with γ = 2.55 and C = 0.0089 for the points computed with E(B−V) < 0.15 and γ = 2.81 and C = 0.0062 for the points computed with E(B−V) < 0.05. This is compared to the M06 model (black dashed line), M95 models (green), and Inoue et al. (2014) (blue).
) on the 2127 LOS probed by the VUDS galaxies. The data of Songaila (2004) are indicated by the black line, and the brown line represents the measurements from Becker (2013). The blue triangles are from Faucher-Giguère et al. (2008a) and the green line indicates the measurement of Dall’Aglio et al. (2008). Right panel: power-law fit of the VUDS HI optical depth τeff as a function of redshift, with τeff = C(1 + z)γ with γ = 2.55 and C = 0.0089 for the points computed with E(B−V) < 0.15 and γ = 2.81 and C = 0.0062 for the points computed with E(B−V) < 0.05. This is compared to the M06 model (black dashed line), M95 models (green), and Inoue et al. (2014) (blue).
Current usage metrics show cumulative count of Article Views (full-text article views including HTML views, PDF and ePub downloads, according to the available data) and Abstracts Views on Vision4Press platform.
Data correspond to usage on the plateform after 2015. The current usage metrics is available 48-96 hours after online publication and is updated daily on week days.
Initial download of the metrics may take a while.


