Fig. 1
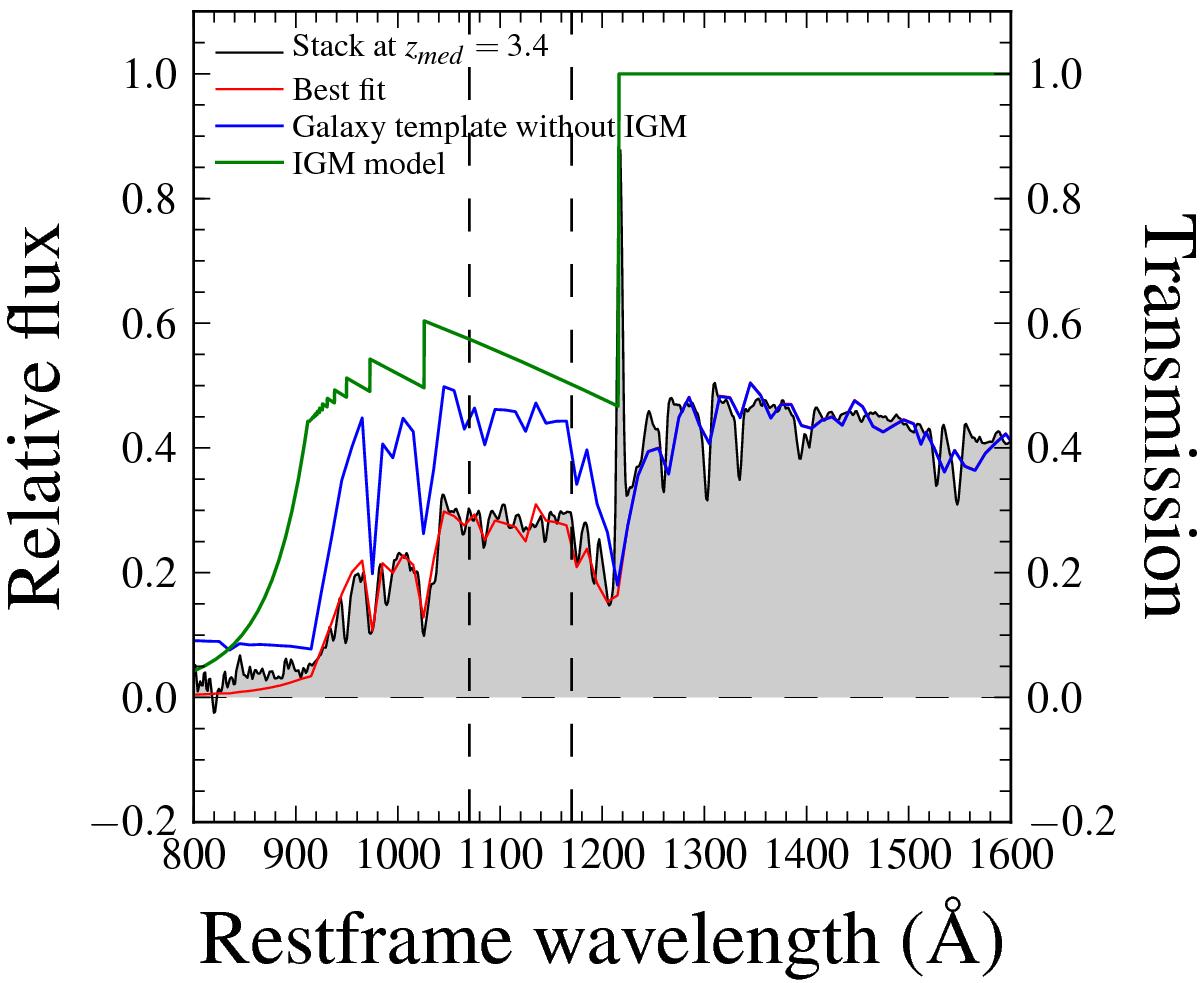
Method adopted for the IGM transmission measurement when fitting VUDS galaxy spectra. The observed spectrum (here a stack with a high signal-to-noise ratio from VUDS galaxies at z ~ 3.4) is presented in black. The best-fit model (see Sect. 3.2) resulting from the combination of a stellar population synthesis model, dust extinction, and IGM transmission is plotted in red. The same stellar population synthesis model with dust but without the IGM transmission applied is shown in blue. The IGM template selected for the best fit is presented in green (the value of the transmission is given on the right y-axis). The IGM transmission is then the average transmission in the wavelength range 1070 ≤ λ ≤ 1170 Å (vertical dashed lines) as measured directly on the IGM template selected in the best fit.
Current usage metrics show cumulative count of Article Views (full-text article views including HTML views, PDF and ePub downloads, according to the available data) and Abstracts Views on Vision4Press platform.
Data correspond to usage on the plateform after 2015. The current usage metrics is available 48-96 hours after online publication and is updated daily on week days.
Initial download of the metrics may take a while.