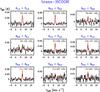
Fig. F.1

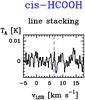
Detected trans-HCOOH rotational lines towards the cold cloud Barnard 1-b. The ordinate refers to the intensity scale in main beam temperature units and the abscissa to the Doppler velocity. Line frequencies (in GHz) are indicated at the top of each panel together with the rotational quantum numbers. The red curve shows an excitation model that reproduces the rotational population diagram. The bottom panel shows the stacked spectra for cis-HCOOH.
Current usage metrics show cumulative count of Article Views (full-text article views including HTML views, PDF and ePub downloads, according to the available data) and Abstracts Views on Vision4Press platform.
Data correspond to usage on the plateform after 2015. The current usage metrics is available 48-96 hours after online publication and is updated daily on week days.
Initial download of the metrics may take a while.