Fig. C.1
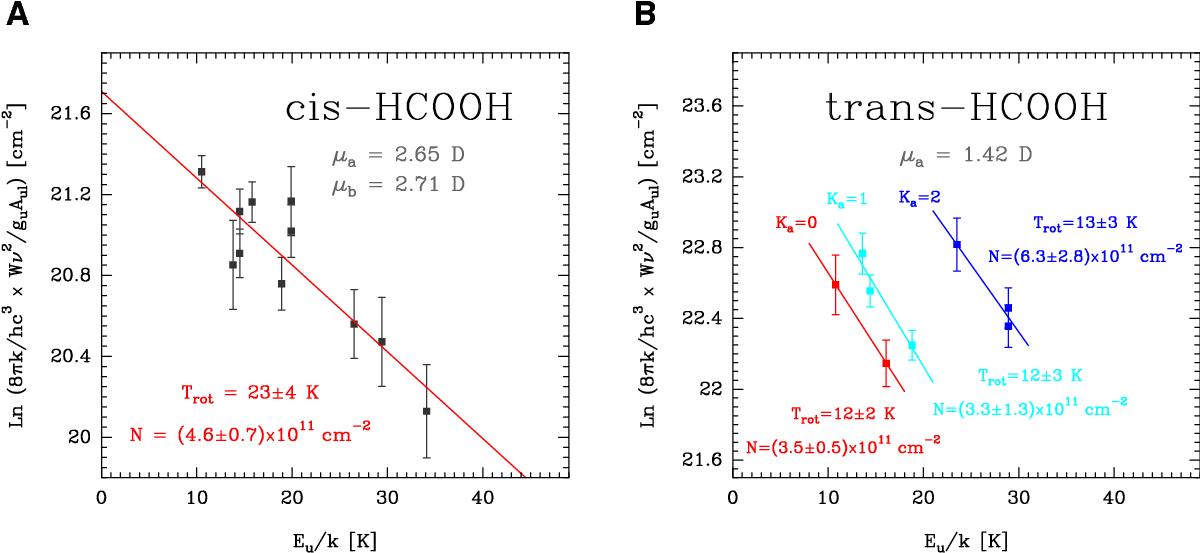
Rotational population diagrams from the observed HCOOH lines towards the Orion Bar, (+10′′, –10′′) position. Left: diagram for the cis conformer (measurements lie along a single component). Right: diagram for the trans conformer showing how different Ka rotational ladders split in different components. Fitted values of the rotational temperature, Trot, and column density, N, are indicated in each panel (see also Table C.1).
Current usage metrics show cumulative count of Article Views (full-text article views including HTML views, PDF and ePub downloads, according to the available data) and Abstracts Views on Vision4Press platform.
Data correspond to usage on the plateform after 2015. The current usage metrics is available 48-96 hours after online publication and is updated daily on week days.
Initial download of the metrics may take a while.