Fig. 1
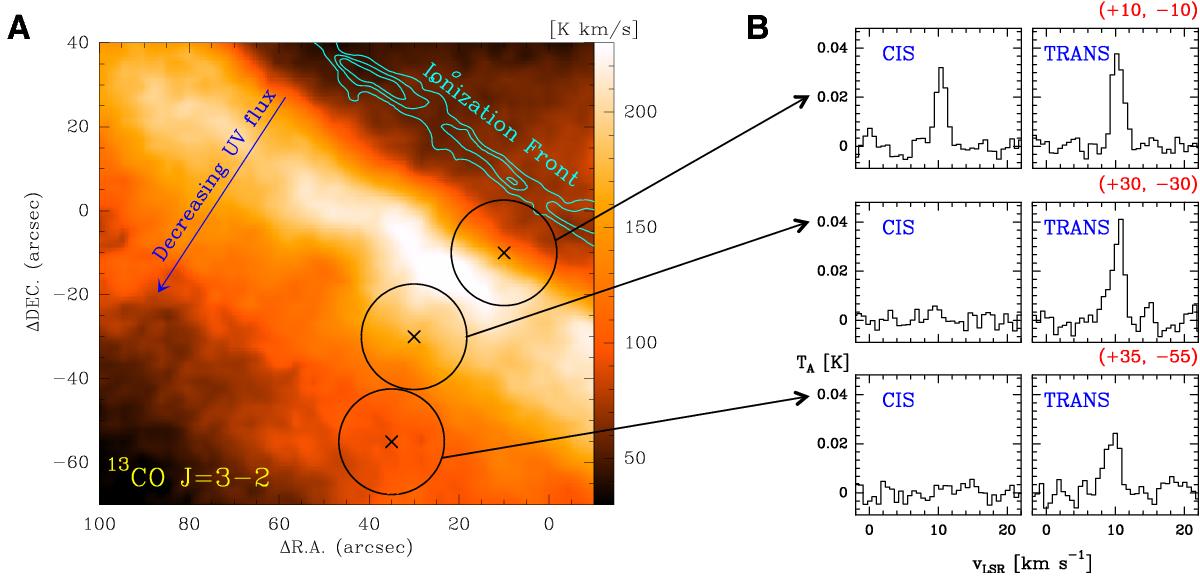
Detection of cis-HCOOH towards the FUV-illuminated edge of the Orion Bar. Left: 13CO J = 3 → 2 integrated emission image with a HPBW of 8′′ obtained with the IRAM-30 m telescope (Cuadrado et al., in prep.). The cyan contour marks the position of neutral cloud boundary traced by the O i 1.317 μm fluorescent line emission (in contours from 3 to 7 by 2 × 10-4 erg s-1 cm-2 sr-1; Walmsley et al. 2000). Right: Cis- and trans-HCOOH stacked spectra towards the observed positions.
Current usage metrics show cumulative count of Article Views (full-text article views including HTML views, PDF and ePub downloads, according to the available data) and Abstracts Views on Vision4Press platform.
Data correspond to usage on the plateform after 2015. The current usage metrics is available 48-96 hours after online publication and is updated daily on week days.
Initial download of the metrics may take a while.