Fig. 6
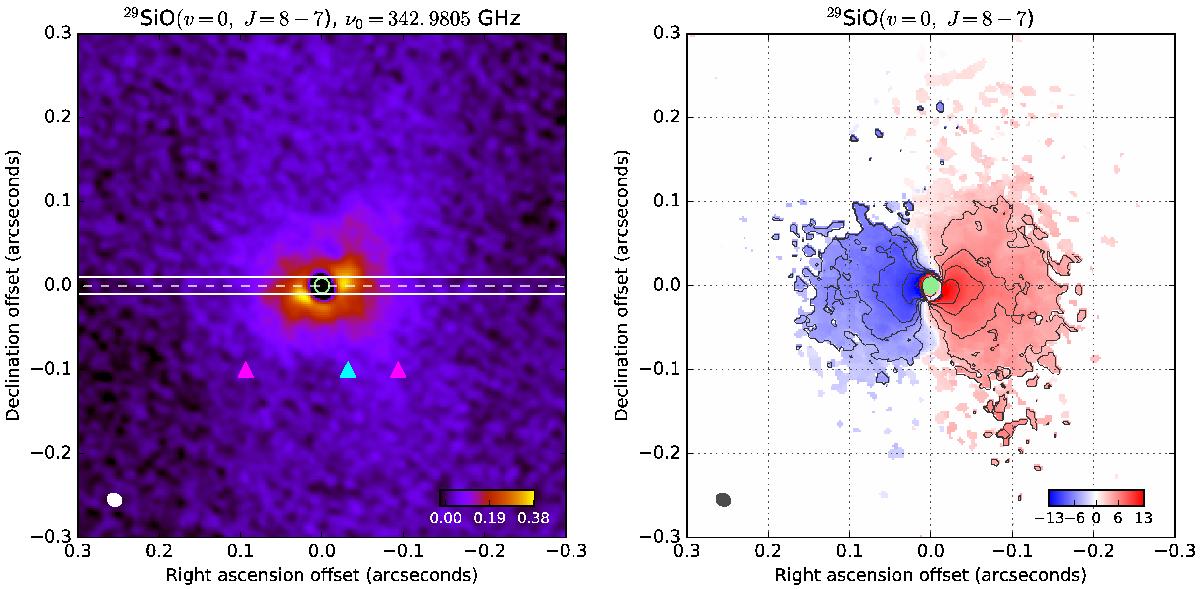
Left panel: map of the emission from L2 Pup in the 29SiO(ν= 0,J = 8−7) line (left), integrated between radial velocities −30 and + 30 km s-1 around the systemic velocity (v0 = 33 km s-1). The pseudo-slit used to compute the position-velocity diagrams is represented with solid white lines. The linear color scale in Jy beam-1 km s-1 is shown in the lower right corner, and the beam size is represented by the ellipse in the lower left corner of the image. The radius of the inner rim (6 AU) and the radius of the companion of L2 Pup are shown with magenta and cyan triangles, respectively. Right panel: map of the first moment emission of the velocity (the color scale is in km s-1). The contours are drawn between 4 and 10 km s-1 with a 2 km s-1 step, and the size of the photosphere is shown with a light green disk.
Current usage metrics show cumulative count of Article Views (full-text article views including HTML views, PDF and ePub downloads, according to the available data) and Abstracts Views on Vision4Press platform.
Data correspond to usage on the plateform after 2015. The current usage metrics is available 48-96 hours after online publication and is updated daily on week days.
Initial download of the metrics may take a while.