Fig. A.1
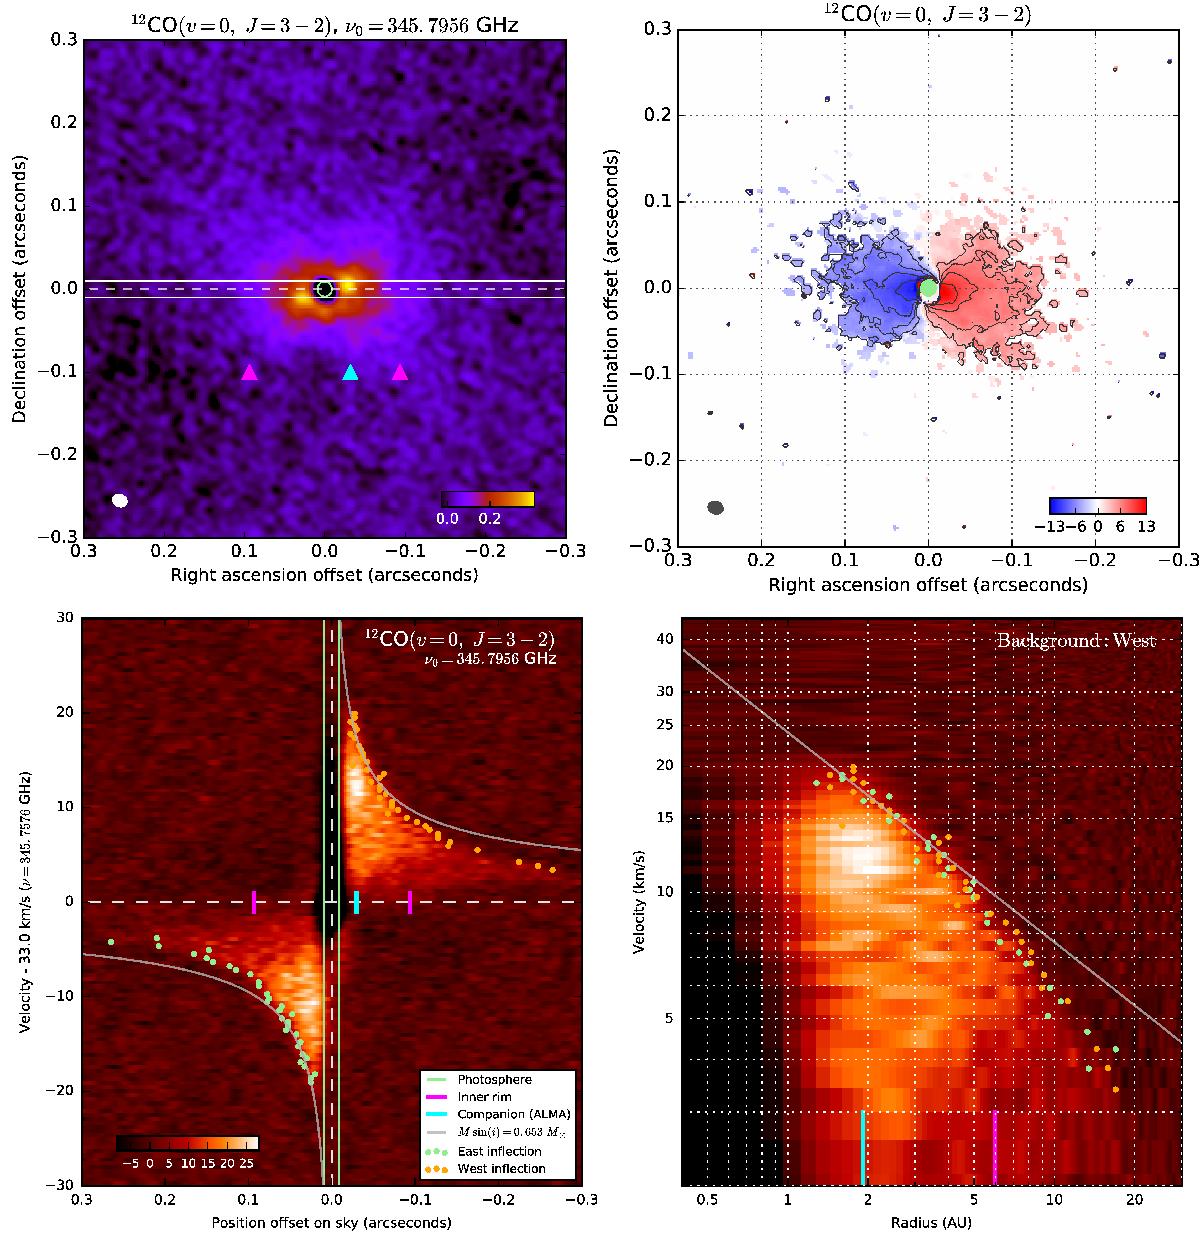
Top left panel: Map of the emission from L2 Pup in the 12CO(ν= 0,J = 3−2) line. Top right panel: first moment of velocity map (color scale in km s-1). The contours are drawn between 4 and 10 km s-1 with a 2 km s-1 step, and the size of the photosphere is shown with a light green disk. Bottom panels: position-velocity diagram of the 12CO(ν= 0,J = 3−2) emission line. The Keplerian velocity profile corresponding to a central mass of Msin(i) = 0.653 M⊙ (determined from the 29SiO line fit) is shown with gray curves in the two panels.
Current usage metrics show cumulative count of Article Views (full-text article views including HTML views, PDF and ePub downloads, according to the available data) and Abstracts Views on Vision4Press platform.
Data correspond to usage on the plateform after 2015. The current usage metrics is available 48-96 hours after online publication and is updated daily on week days.
Initial download of the metrics may take a while.