Fig. 1
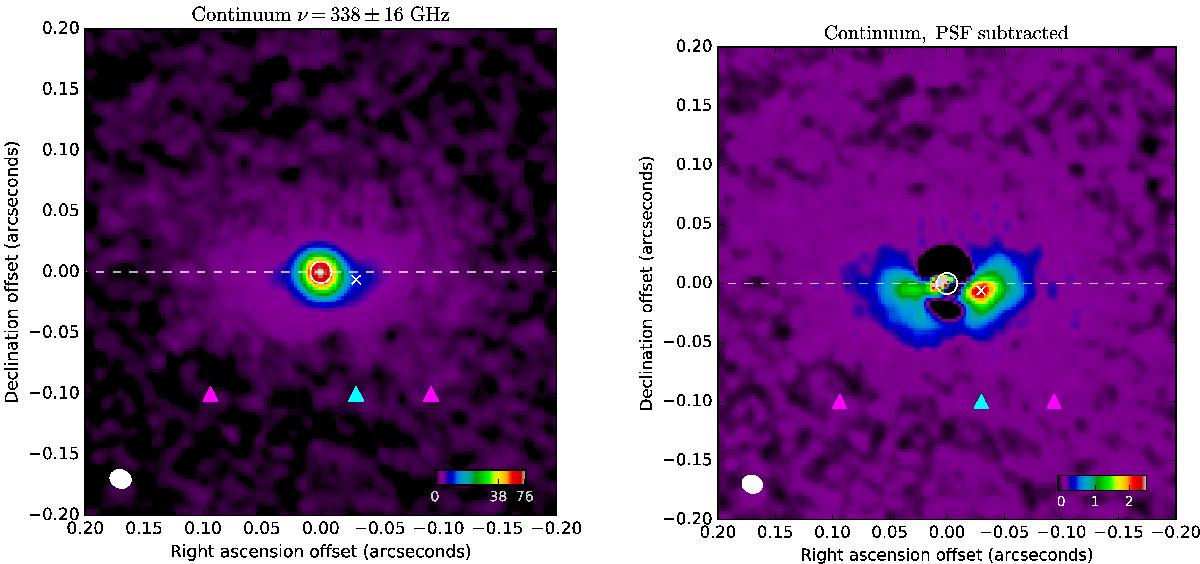
Left panel: continuum emission from L2 Pup at ν = 338 ± 16 GHz. Right panel: PSF-subtracted continuum emission map. The color scales are a function of the square root of the intensity in mJy beam-1 km s-1. The white cross marks the position of the secondary source in the PSF-subtracted ALMA image. The triangular symbols are pointers to the inner rim of the dust disk (6 AU, magenta) and of the secondary source detected in the visible by Kervella et al. (2015; cyan), shifted by −0.1″ in declination. The position of source B from ALMA is marked with a white cross, and the size of the photosphere of the star is shown as a white circle. The 17.7 × 14.5 mas beam is represented in the lower left corner of the images.
Current usage metrics show cumulative count of Article Views (full-text article views including HTML views, PDF and ePub downloads, according to the available data) and Abstracts Views on Vision4Press platform.
Data correspond to usage on the plateform after 2015. The current usage metrics is available 48-96 hours after online publication and is updated daily on week days.
Initial download of the metrics may take a while.