Fig. 3
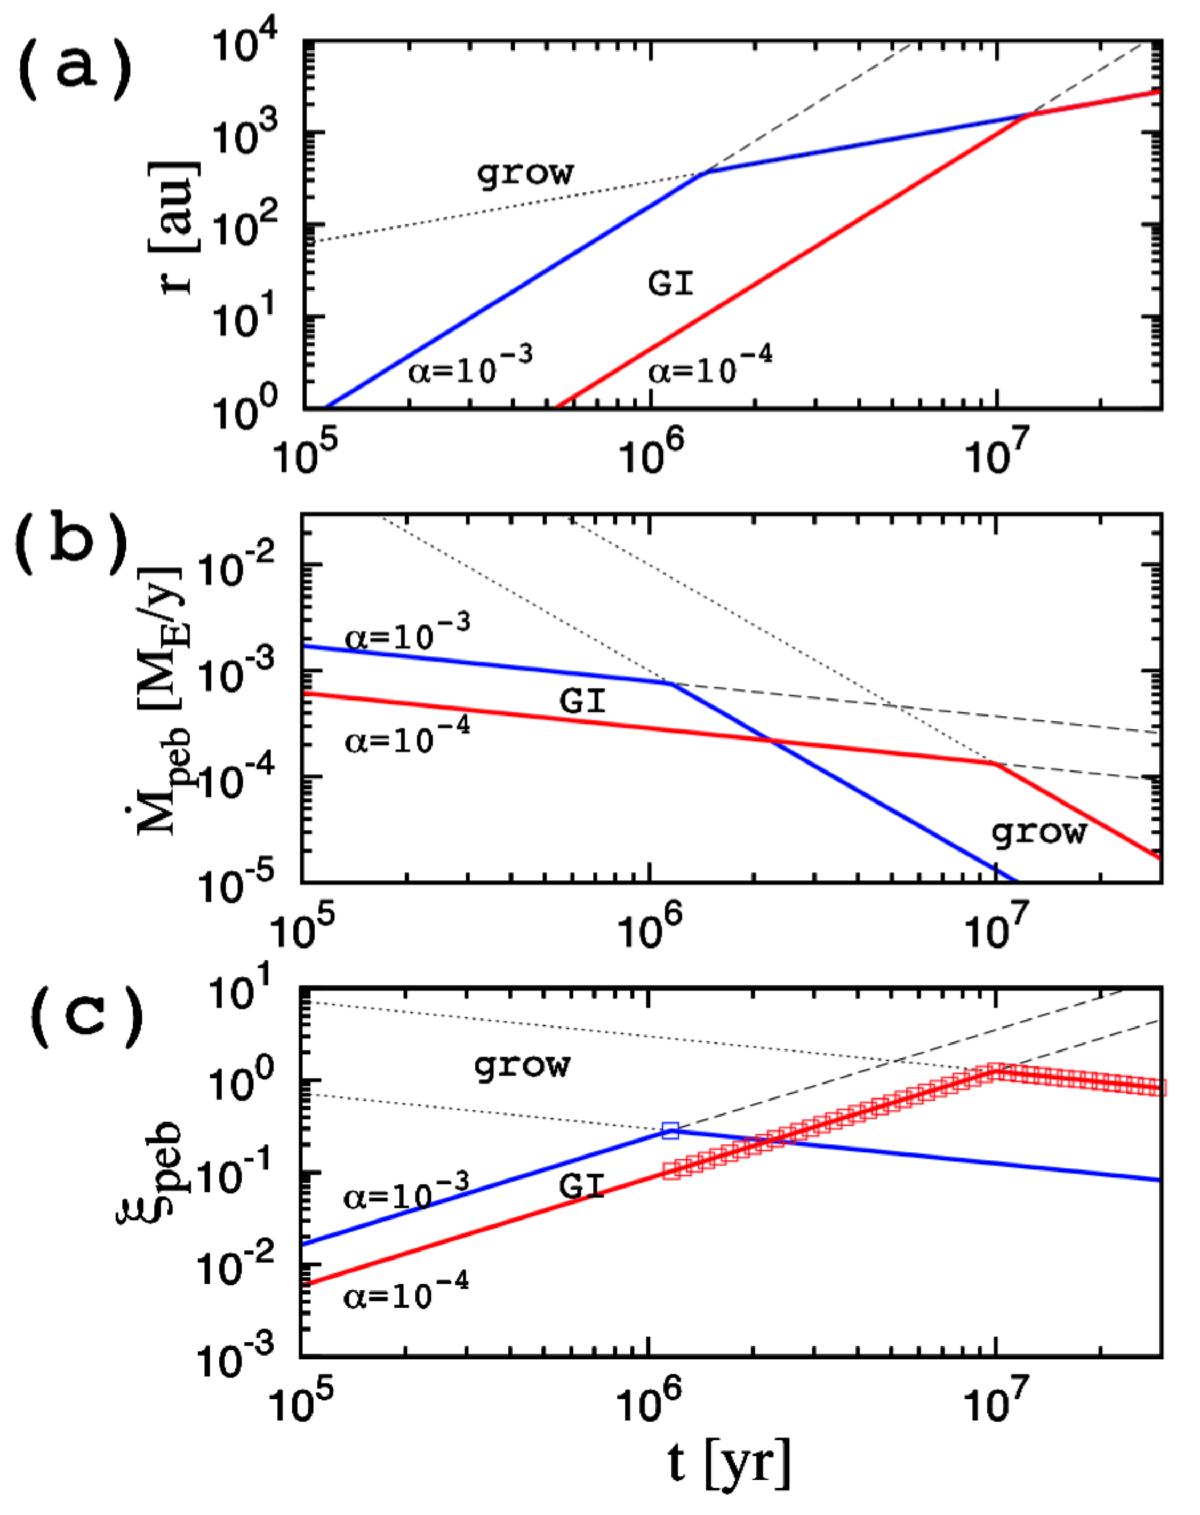
Time evolution of a) radius of the pebble formation front, b) pebble accretion rate (Ṁpeb), and c) ξpeb = Ṁpeb/Ṁ∗ for two values of α, 10-4 (red) and 10-3 (blue). The lines labeled “grow” (dotted) and “GI” (dashed) represent the pebble growth and disk GI limits, respectively. The thick solid lines express the actual values obtained by the minima of the two limits. Here we assumed τs,peb = 0.1 and Z0 = 0.01. In panel c), the small squares represent the points with ξpeb>ξcrit, see Eq. (18).
Current usage metrics show cumulative count of Article Views (full-text article views including HTML views, PDF and ePub downloads, according to the available data) and Abstracts Views on Vision4Press platform.
Data correspond to usage on the plateform after 2015. The current usage metrics is available 48-96 hours after online publication and is updated daily on week days.
Initial download of the metrics may take a while.