Free Access
Fig. 7
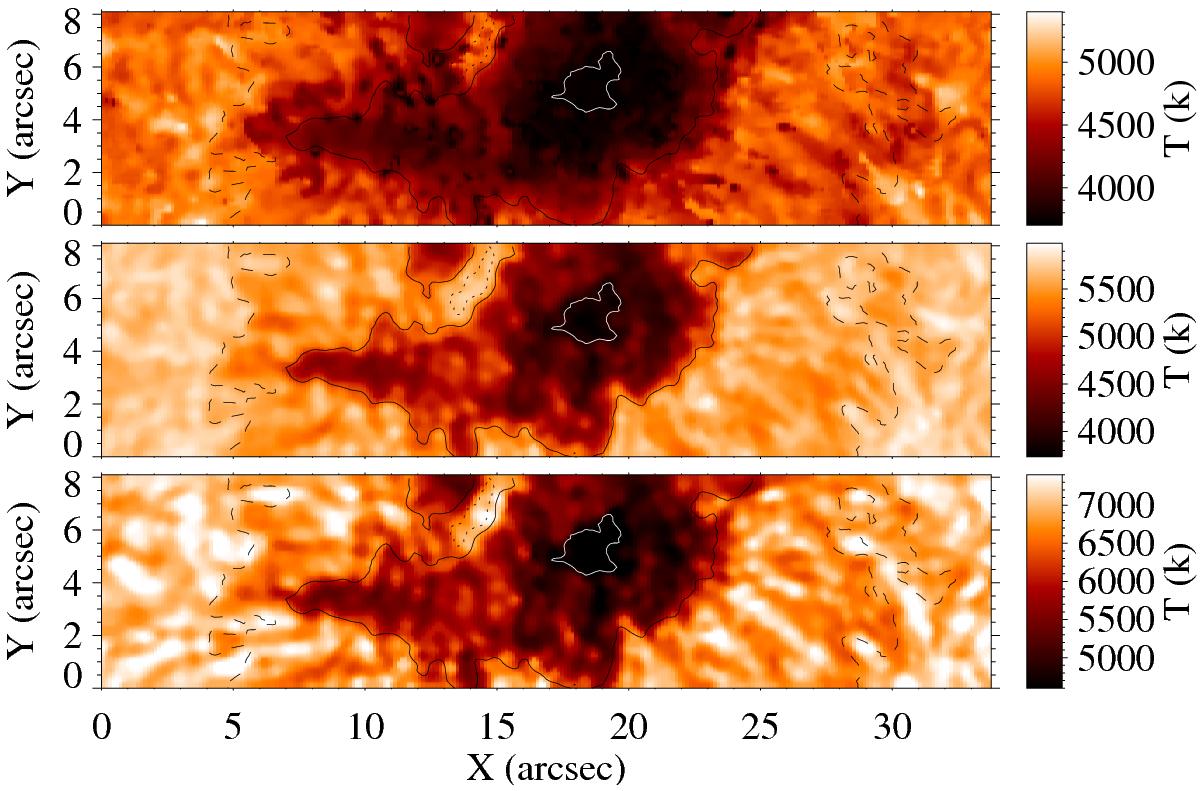
Temperature map inferred from simultaneous inversions of Ca i 10 839 Å and Si i 10 827 Å lines at log τ = −2.2 (top panel), log τ = −0.5 (middle panel), and log τ = 0.3 (bottom panel). Contour lines correspond to the same masks as defined in Fig. 3.
Current usage metrics show cumulative count of Article Views (full-text article views including HTML views, PDF and ePub downloads, according to the available data) and Abstracts Views on Vision4Press platform.
Data correspond to usage on the plateform after 2015. The current usage metrics is available 48-96 hours after online publication and is updated daily on week days.
Initial download of the metrics may take a while.