Fig. 3
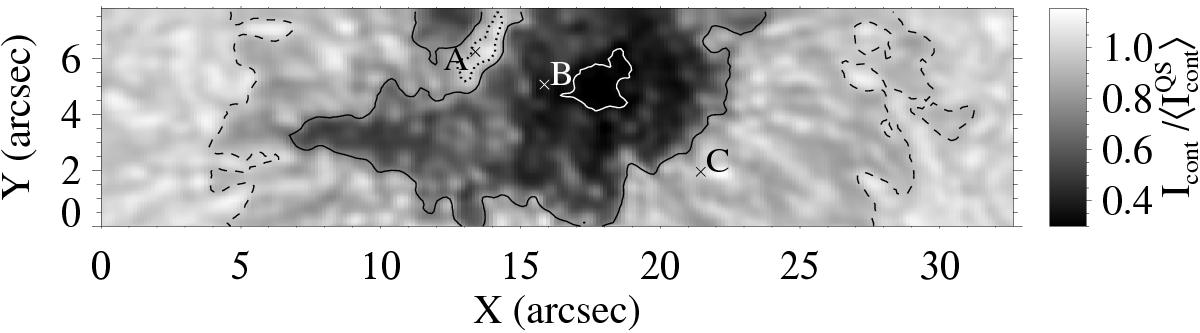
Continuum intensity map normalized to the average continuum intensity in the quiet Sun ![]() obtained with GRIS on June 27 between 08:46 and 08:50 UT. Points A, B, and C correspond to the locations used for Figs. 1, 4–6. The contour lines mark the boundaries of the masks used for the analysis in Sect. 4: dark umbra inside the white line, faint umbra delimited by the black solid line and the white line, penumbra between the black solid line and the dashed lines, and the light bridge lies inside the dotted line.
obtained with GRIS on June 27 between 08:46 and 08:50 UT. Points A, B, and C correspond to the locations used for Figs. 1, 4–6. The contour lines mark the boundaries of the masks used for the analysis in Sect. 4: dark umbra inside the white line, faint umbra delimited by the black solid line and the white line, penumbra between the black solid line and the dashed lines, and the light bridge lies inside the dotted line.
Current usage metrics show cumulative count of Article Views (full-text article views including HTML views, PDF and ePub downloads, according to the available data) and Abstracts Views on Vision4Press platform.
Data correspond to usage on the plateform after 2015. The current usage metrics is available 48-96 hours after online publication and is updated daily on week days.
Initial download of the metrics may take a while.