Fig. 2
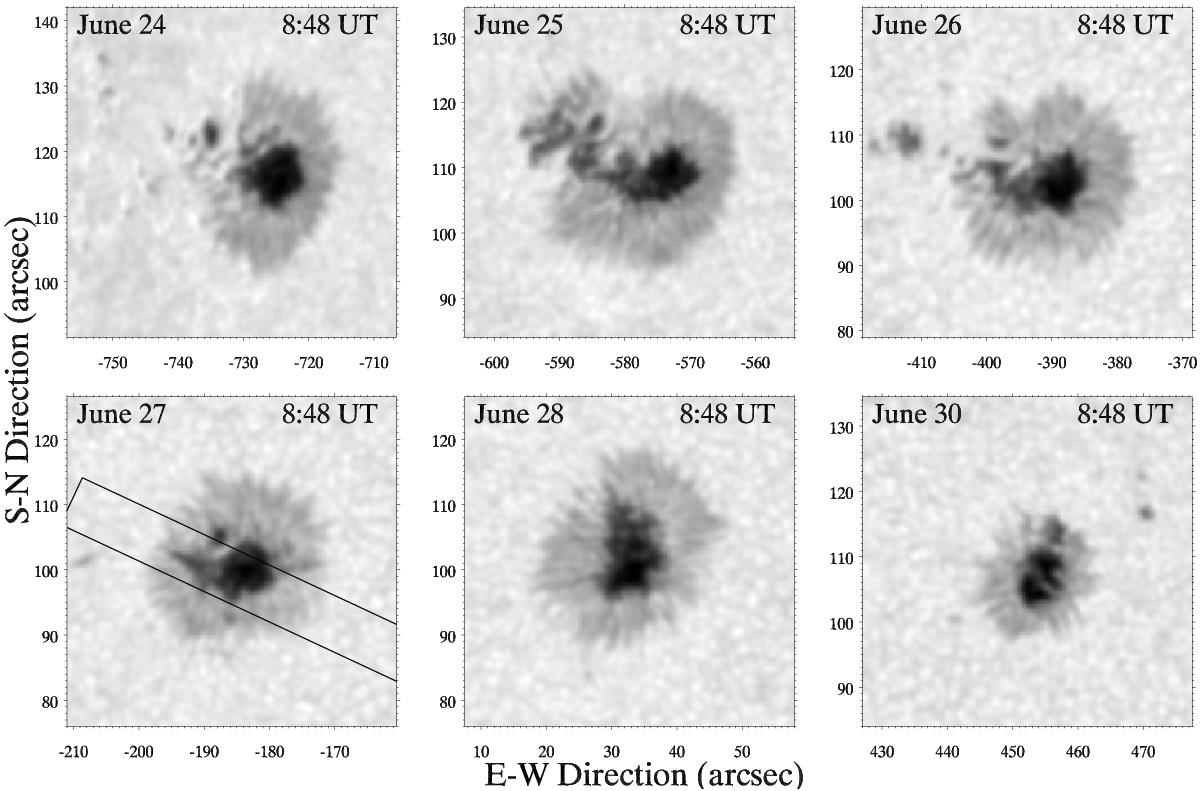
HMI continuum images of the evolution of the active region NOAA 12096 between 2014 June 24–30. Date and time of the images are indicated at the top of each panel. The tilted rectangle in the bottom left panel indicates the FOV covered by the GRIS observations. The temporal evolution of the sunspot while crossing the solar disk is available as a movie in the online edition. In that movie the location of the sunspot is indicated by a red box in an inset showing the full disk.
Current usage metrics show cumulative count of Article Views (full-text article views including HTML views, PDF and ePub downloads, according to the available data) and Abstracts Views on Vision4Press platform.
Data correspond to usage on the plateform after 2015. The current usage metrics is available 48-96 hours after online publication and is updated daily on week days.
Initial download of the metrics may take a while.