Fig. 6
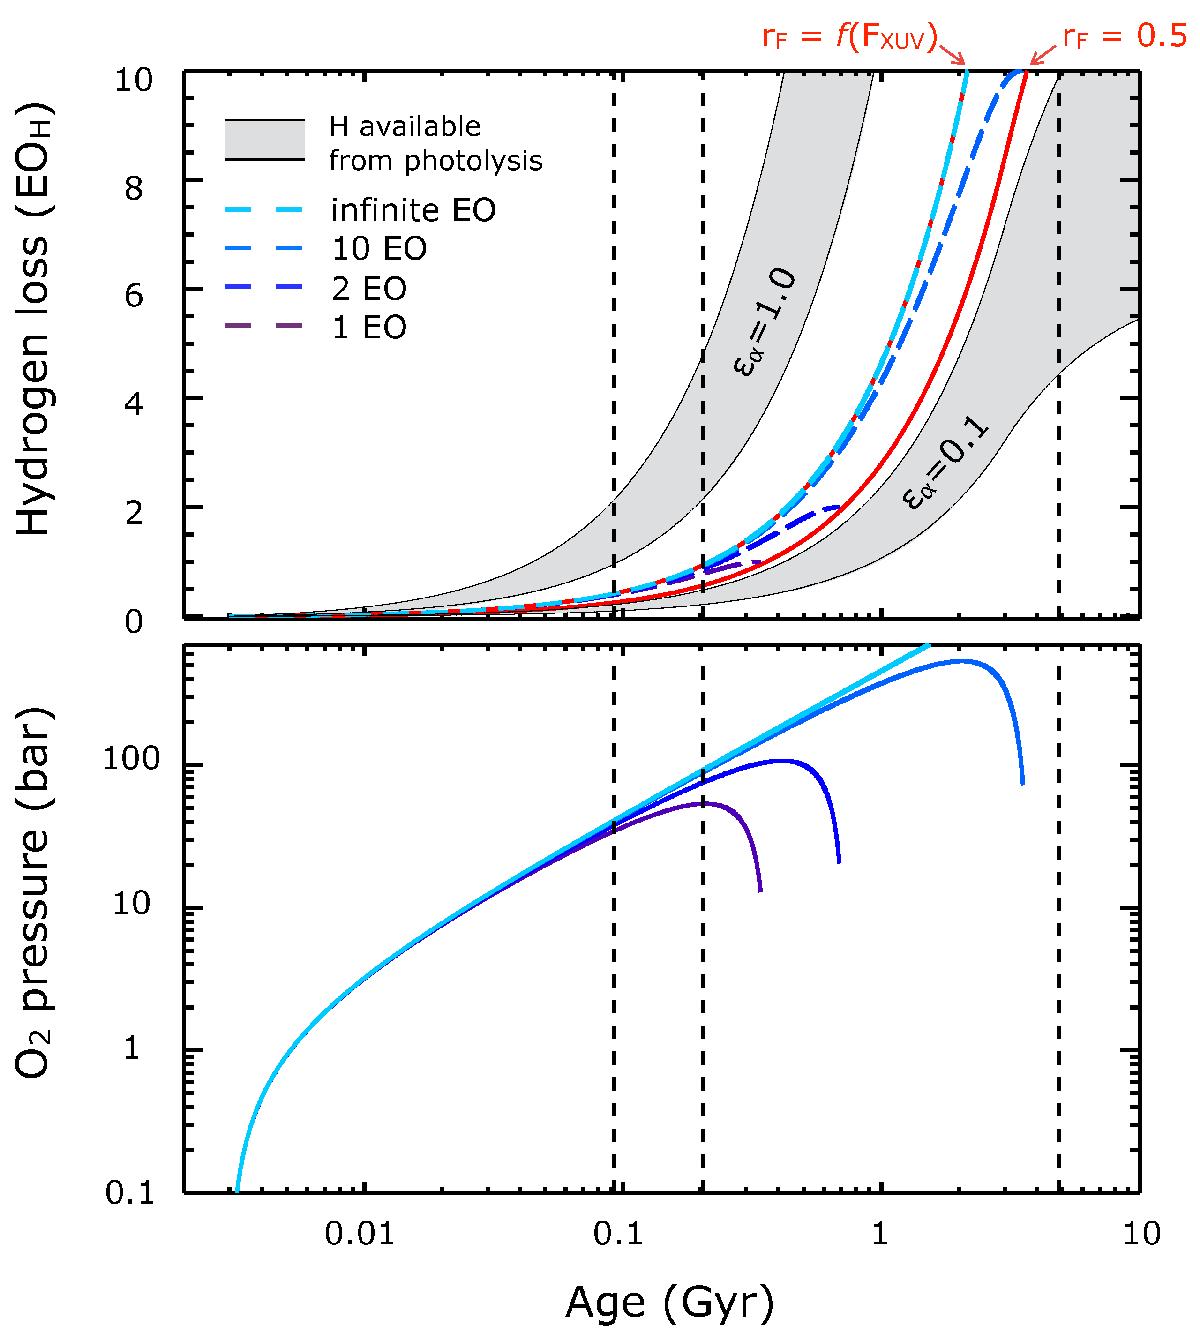
Hydrogen loss and O2 pressure for Proxima-b for an initial time of t0 = 3 Myr. Top panel: hydrogen loss computed with method (1) and (2) in full red lines and with method (3) in colored dashed lines. The gray areas correspond to the amount of hydrogen created by photolysis for two different efficiencies ϵα = 1.0 (all the incoming energy is used for photolysis) and ϵα = 0.1 (only 10% of the incoming energy is used). The edges of the gray areas were calculated using two different assumptions on the wavelength range important for photolysis: the lower edge corresponds to the energy flux in the H Ly α band (Table 2), the upper edge corresponds to the energy flux in a wider band: 10–170 nm. The vertical lines represent the time at which the planet reaches the 1.5 S⊕ HZ inner edge, the 0.9 S⊕ HZ inner edge and the age of the system (4.8 Gyr). Bottom panel: O2 pressure building up in the atmosphere computed with method (3).
Current usage metrics show cumulative count of Article Views (full-text article views including HTML views, PDF and ePub downloads, according to the available data) and Abstracts Views on Vision4Press platform.
Data correspond to usage on the plateform after 2015. The current usage metrics is available 48-96 hours after online publication and is updated daily on week days.
Initial download of the metrics may take a while.