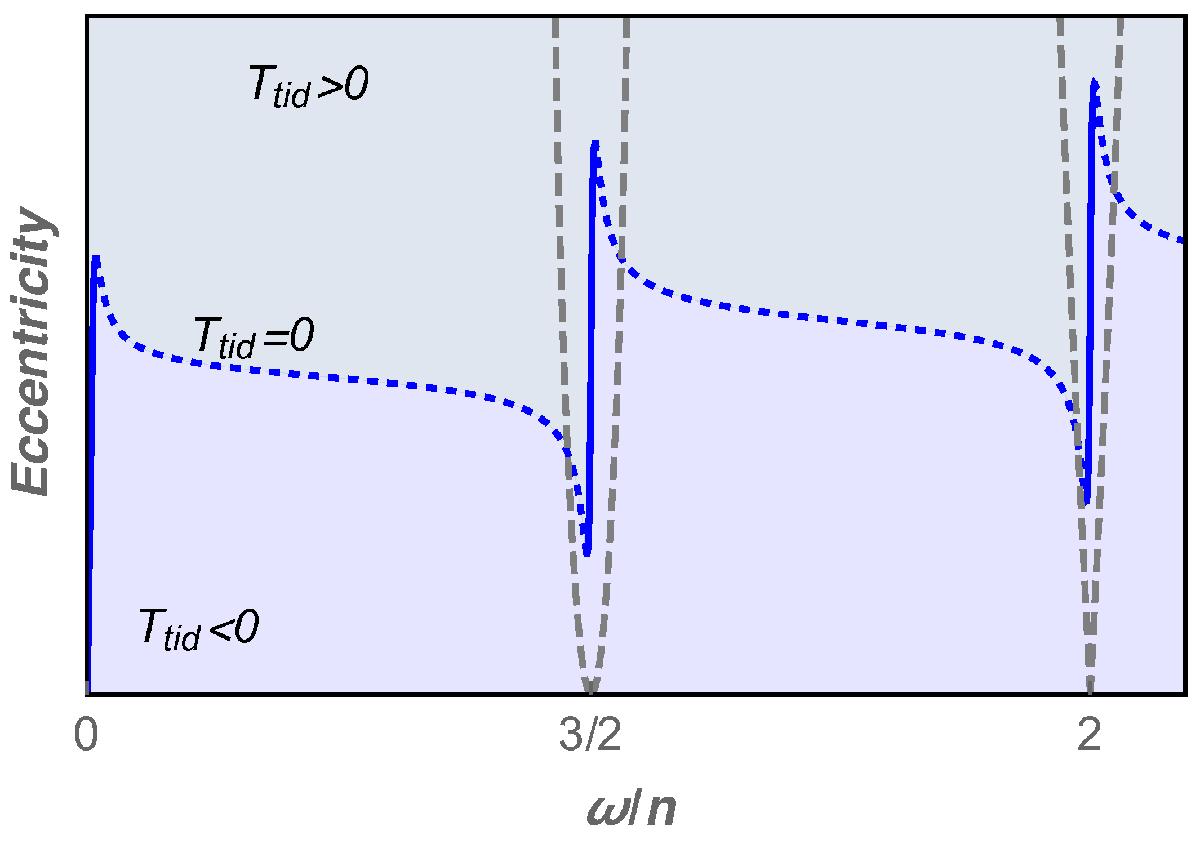
Fig. 5

Sketch of the equilibrium eccentricity, whence the tidal torque vanishes, as a function of planetary rotation rate (blue curve). Solid portions of the curve near resonances depict stable equilibria, whereas dotted portions show unstable ones. Areas of positive torque are in gray, and of negative torque in blue. Dashed gray curves show the area covered by librations inside the resonances, that is, the resonance width (see Eq. (7)). With realistic values for the triaxiality and the Maxwell time, both the kink around the resonances and the resonance width would be much narrower and difficult to see.
Current usage metrics show cumulative count of Article Views (full-text article views including HTML views, PDF and ePub downloads, according to the available data) and Abstracts Views on Vision4Press platform.
Data correspond to usage on the plateform after 2015. The current usage metrics is available 48-96 hours after online publication and is updated daily on week days.
Initial download of the metrics may take a while.


