Fig. 4
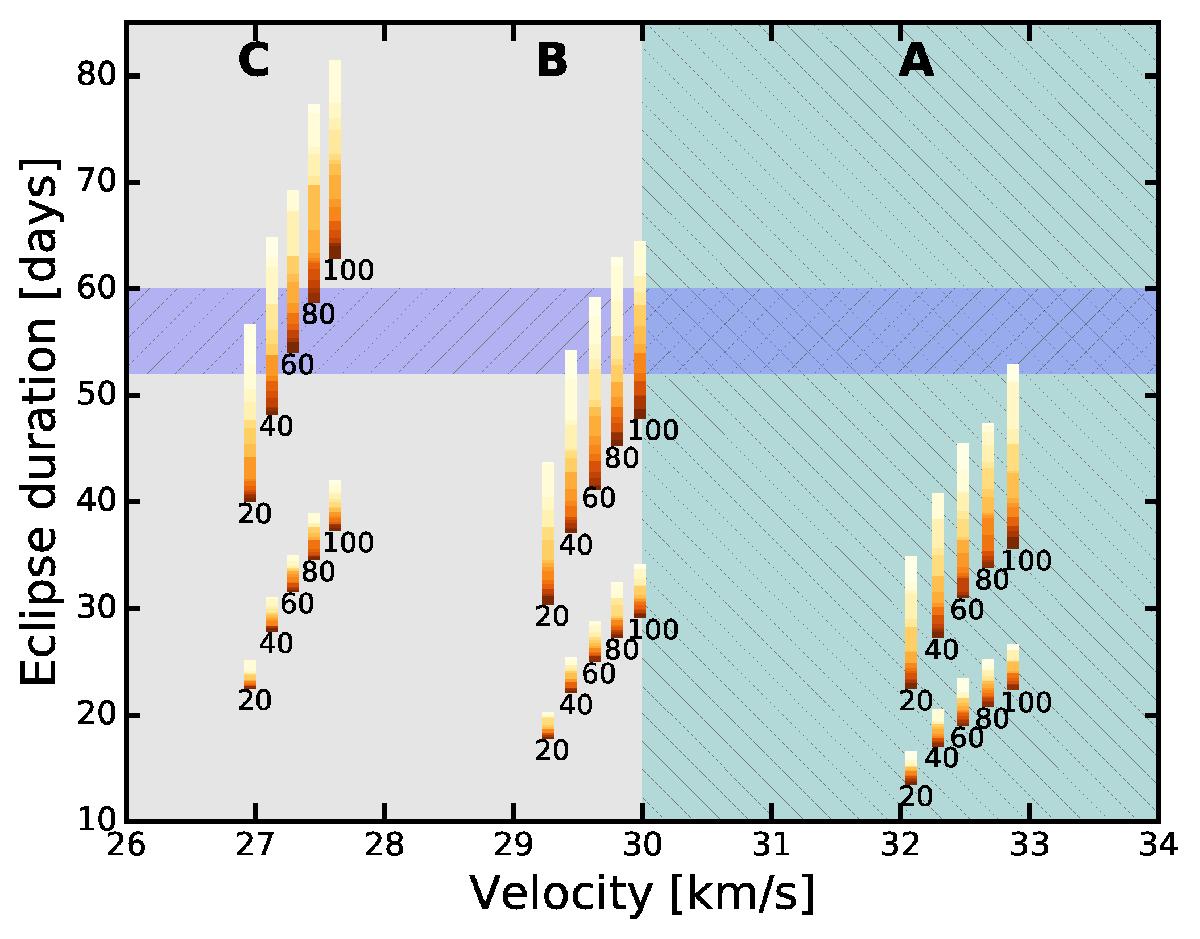
Evolution of the eclipse duration at pericentre for the simulation models. The hashed blue region indicates the observed duration of 56 ± 4 days, while the hashed turquoise region indicates the observed velocity of 32 ± 2 km s-1. The upper models with the longer eclipse duration are the retrograde models, the lower models are the prograde ones. The colour bar indicates the age of the model in log 10-scale: lightest is after 3000 yr, while darkest is after 105 yr.
Current usage metrics show cumulative count of Article Views (full-text article views including HTML views, PDF and ePub downloads, according to the available data) and Abstracts Views on Vision4Press platform.
Data correspond to usage on the plateform after 2015. The current usage metrics is available 48-96 hours after online publication and is updated daily on week days.
Initial download of the metrics may take a while.