Fig. 4
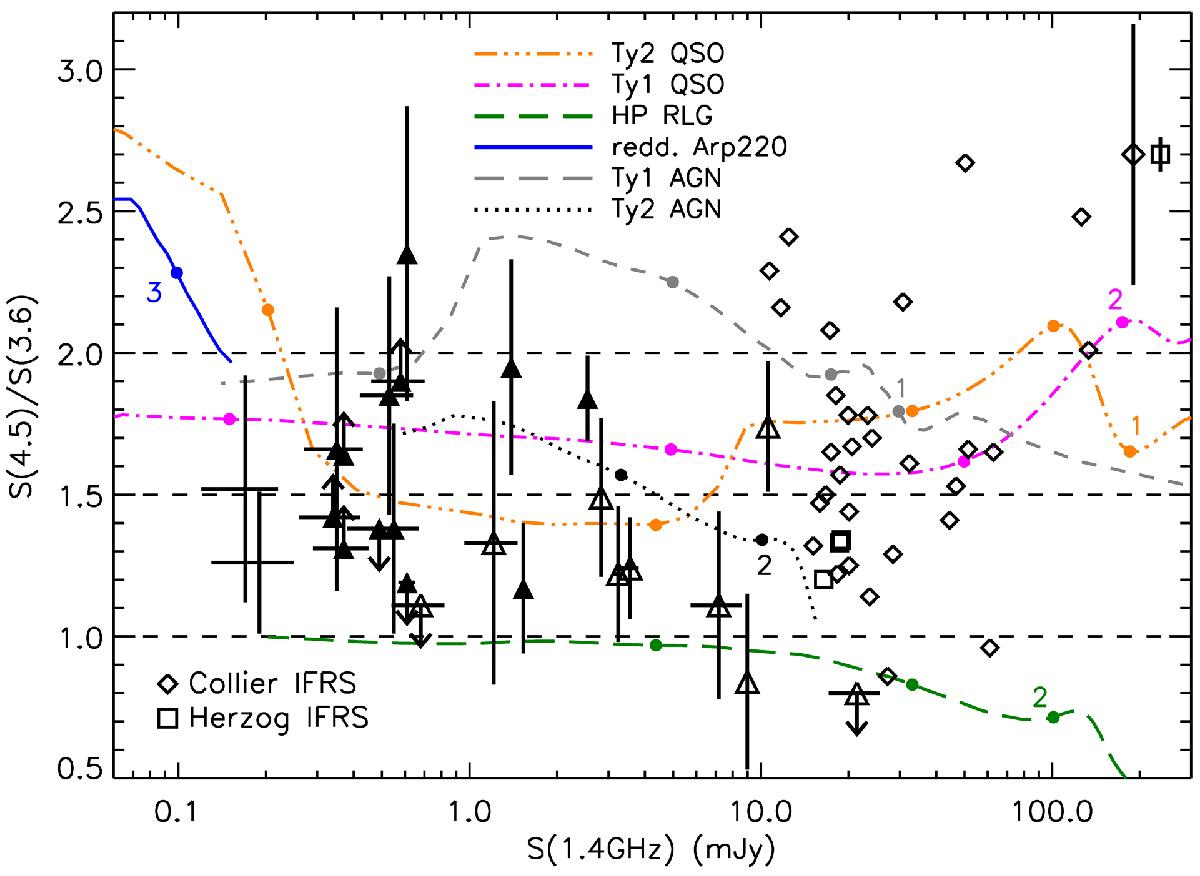
S4.5 μm/S3.6 μm ratios versus 1.4 GHz flux density for IFRS sources. Sources detected only at one IR band (either 3.6 or 4.5 μm), are indicated by the corresponding upper or lower limits. The dashed horizontal lines refer to S4.5 μm/S3.6 μm ratios equal to 1.0, 1.5, and 2.0 respectively. The superimposed tracks refer to HP Type 2 and 1 QSOs (triple dot-dashed orange and dot-dashed magenta respectively), HP RLGs (long-dashed green), Type 1 and 2 AGNs (dashed and dotted grey, respectively), and reddened Arp 220 (solid blue). The redshift increases along the tracks toward the left-hand side of the plot; unitary increments in redshift are marked by dots, starting from the value reported near the first dot on each track. LP QSOs would show a similar track to HP QSOs, but slightly shifted to the left, and are not shown. All the tracks have been drawn in the redshift range within which R3.6 > 50, which is close to the smaller value we measured for our IFRSs (see Table B.1). Empty diamonds and empty squares represent the positions of the IFRSs with redshift from Collier et al. (2014) and Herzog et al. (2014), respectively. In the top-right corner of the plot are shown the median errors for these two samples. Upward empty and filled triangles indicate IFRSs from our sample with R3.6> 500 and between 200 and 500, respectively. The two radio-faintest sources are ES0593 and ES0436, both with R3.6 values below 100. None of the reliably identified IFRSs shown in this plot has R3.6 between 100 and 200.
Current usage metrics show cumulative count of Article Views (full-text article views including HTML views, PDF and ePub downloads, according to the available data) and Abstracts Views on Vision4Press platform.
Data correspond to usage on the plateform after 2015. The current usage metrics is available 48-96 hours after online publication and is updated daily on week days.
Initial download of the metrics may take a while.