Fig. 3
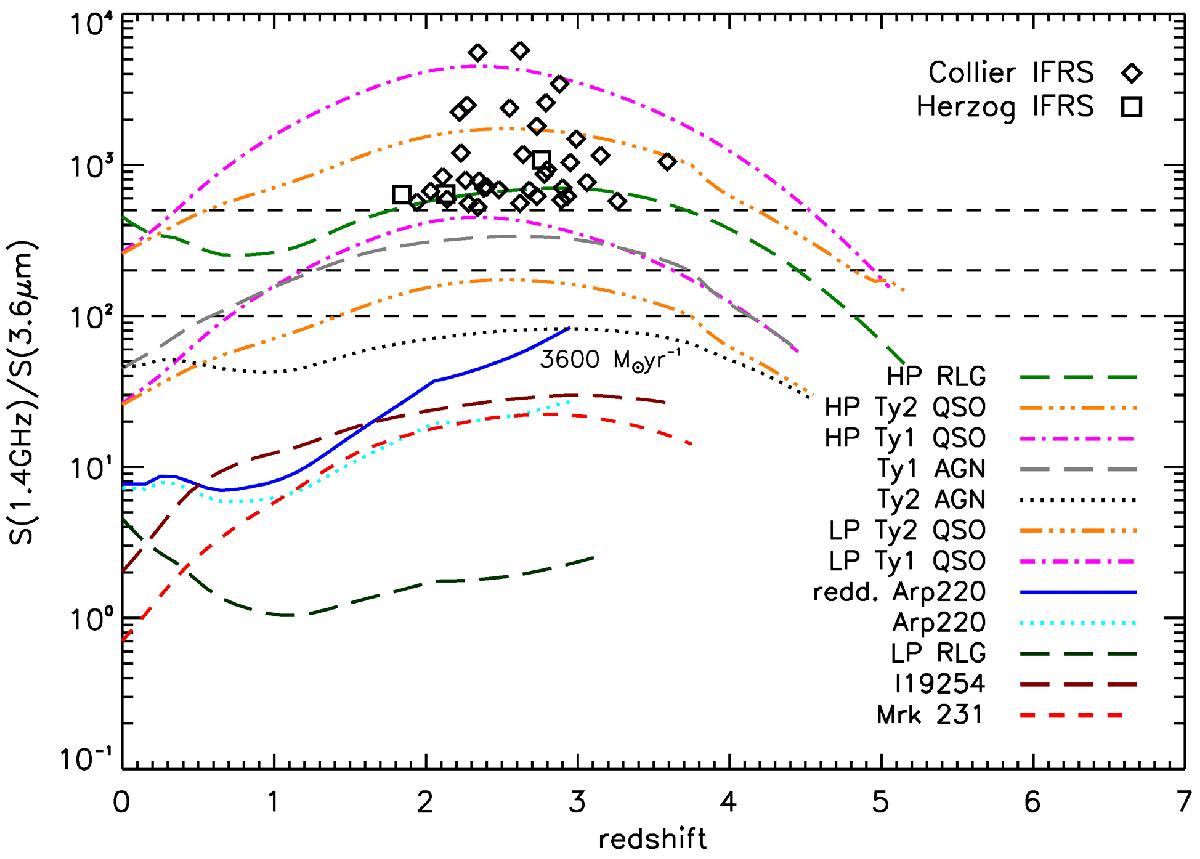
R3.6 ratio evolutionary tracks; in this plot each track is truncated at the redshift at which the radio flux density drops below the detection limit S1.4 GHz ~ 100 μJy. The horizontal dashed lines indicate R3.6 ratios of 100, 200, and 500. The errors associated to the measured R3.6 ratios of the Collier et al. (2014) and Herzog et al. (2014) samples are of the same magnitude of the symbols reported in the plot, and not shown. At the end of the Arp 220 reddened track we indicate the star formation rate expected for this source if it were at redshift ~3, under the hypothesis that star-forming activity entirely accounts for the radio emission in this object.
Current usage metrics show cumulative count of Article Views (full-text article views including HTML views, PDF and ePub downloads, according to the available data) and Abstracts Views on Vision4Press platform.
Data correspond to usage on the plateform after 2015. The current usage metrics is available 48-96 hours after online publication and is updated daily on week days.
Initial download of the metrics may take a while.