Fig. 2
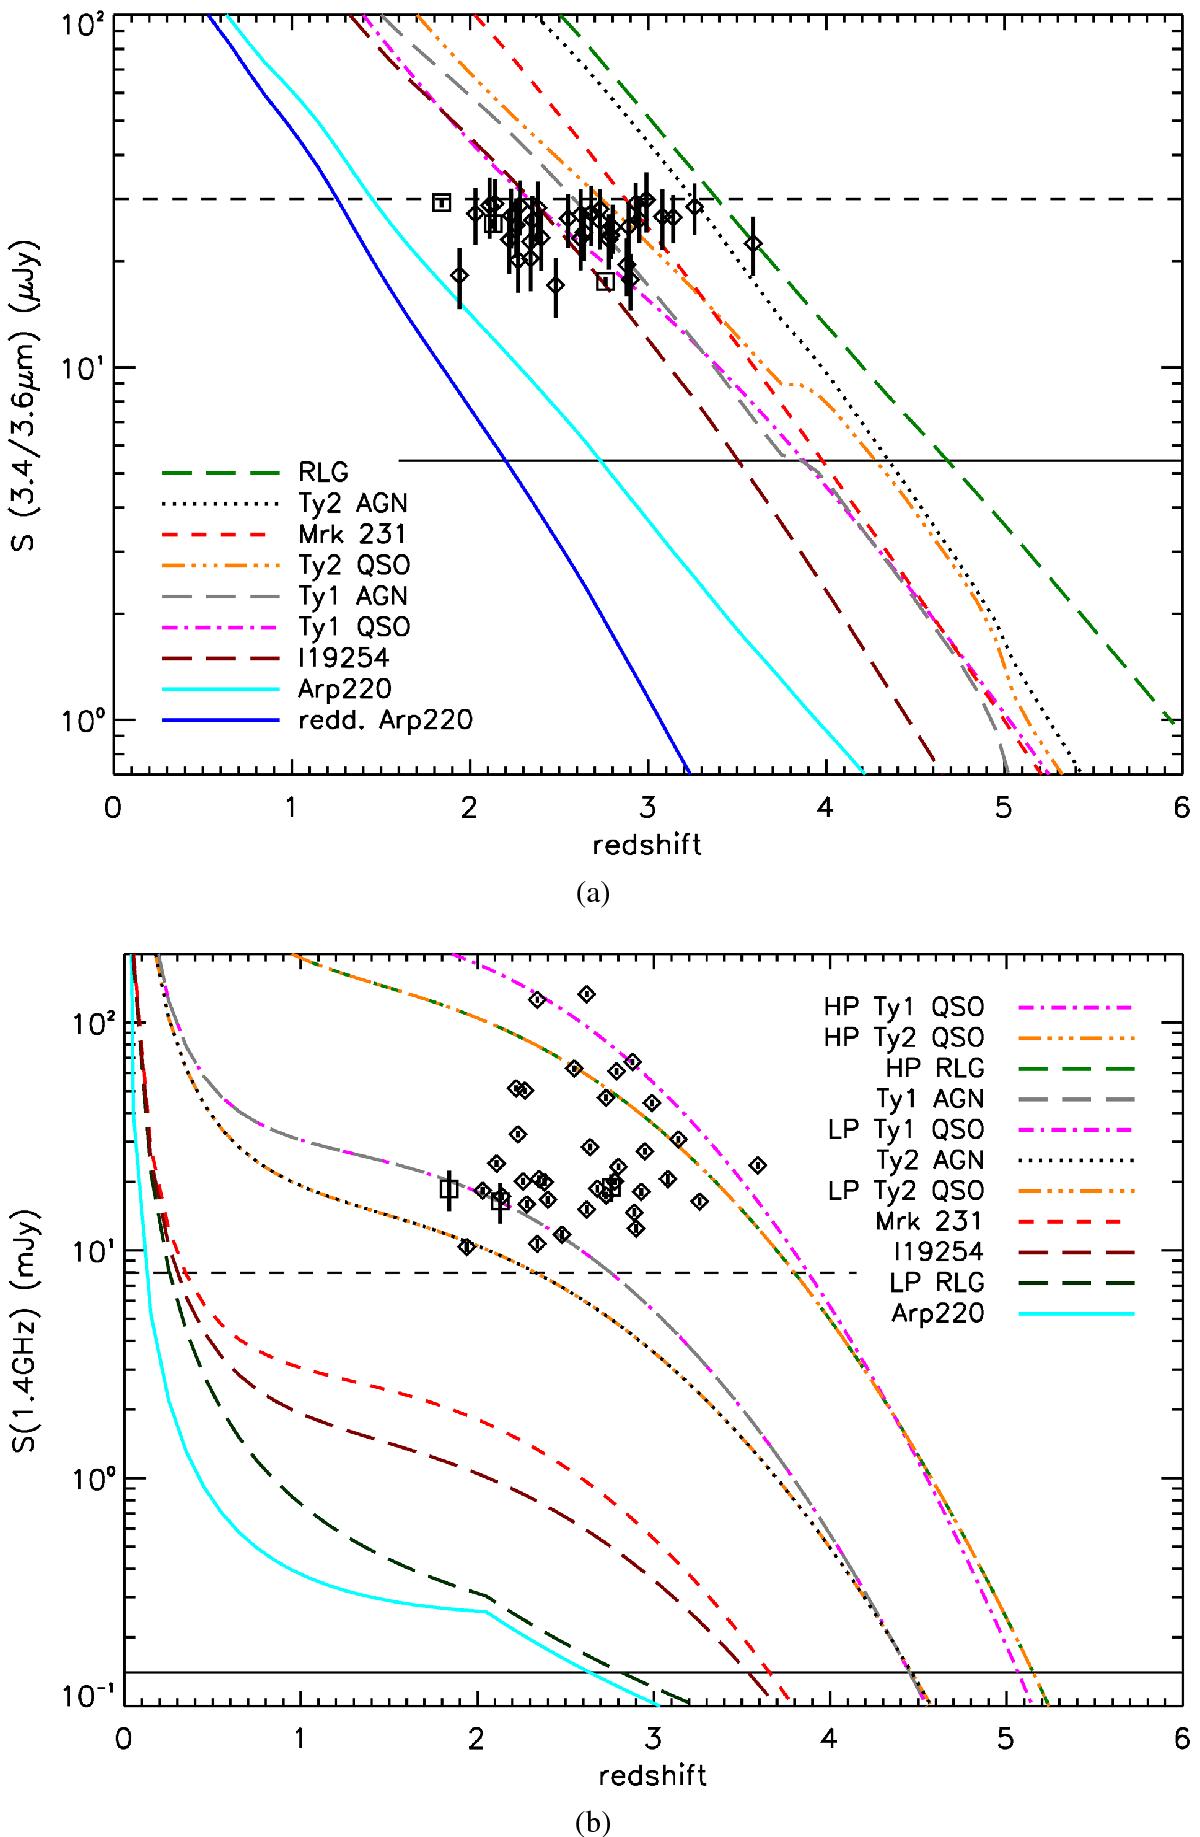
Expected flux densities versus redshift for our models: Type 2 and Type 1 AGNs (dotted black and long-dashed grey tracks, respectively); Type 2 and Type 1 QSOs (triple dot-dashed orange and dot-dashed magenta tracks, respectively); radio galaxies (long-dashed green for high-power and dark green for low-power tracks); Arp 220, without and with reddening (dotted cyan and solid blue tracks, respectively), Mrk 231 (dashed red track), and I19254 (long-dashed brown track). Superimposed are the Collier et al. (2014) and Herzog et al. (2014) IFRSs with measured redshift (empty diamonds and empty squares, respectively). Panel a) – Top: IR fluxes at 3.4 (WISE)/3.6 (SWIRE) μm versus redshift; the dashed horizontal line represents the 30 μJy flux density threshold used by Collier et al. (2014) and Herzog et al. (2014) to select their IFRS samples, while the solid horizontal line represents the largest flux density measured in our sample (LH2633, S3.6 μm~5.43 μJy). Panel b) – Bottom: 1.4 GHz radio flux density versus redshift; high-power Type 2 QSO and RLG trends are superimposed due to the identical modelling we applied, as well as for Type 1 AGN and low-power type 1 QSO, and for Type 2 AGN and low-power Type 2 QSO (see Table 4). The dashed horizontal line indicates the lowest 1.4 GHz flux density measured in Collier et al. (2014) and Herzog et al. (2014) samples (7.98 mJy, see Sect. 1), while the solid horizontal line indicates the lowest 1.4 GHz flux density measured in our sample (ES0463, S1.4 GHz~0.14 mJy, see Table B.1).
Current usage metrics show cumulative count of Article Views (full-text article views including HTML views, PDF and ePub downloads, according to the available data) and Abstracts Views on Vision4Press platform.
Data correspond to usage on the plateform after 2015. The current usage metrics is available 48-96 hours after online publication and is updated daily on week days.
Initial download of the metrics may take a while.