Fig. 1
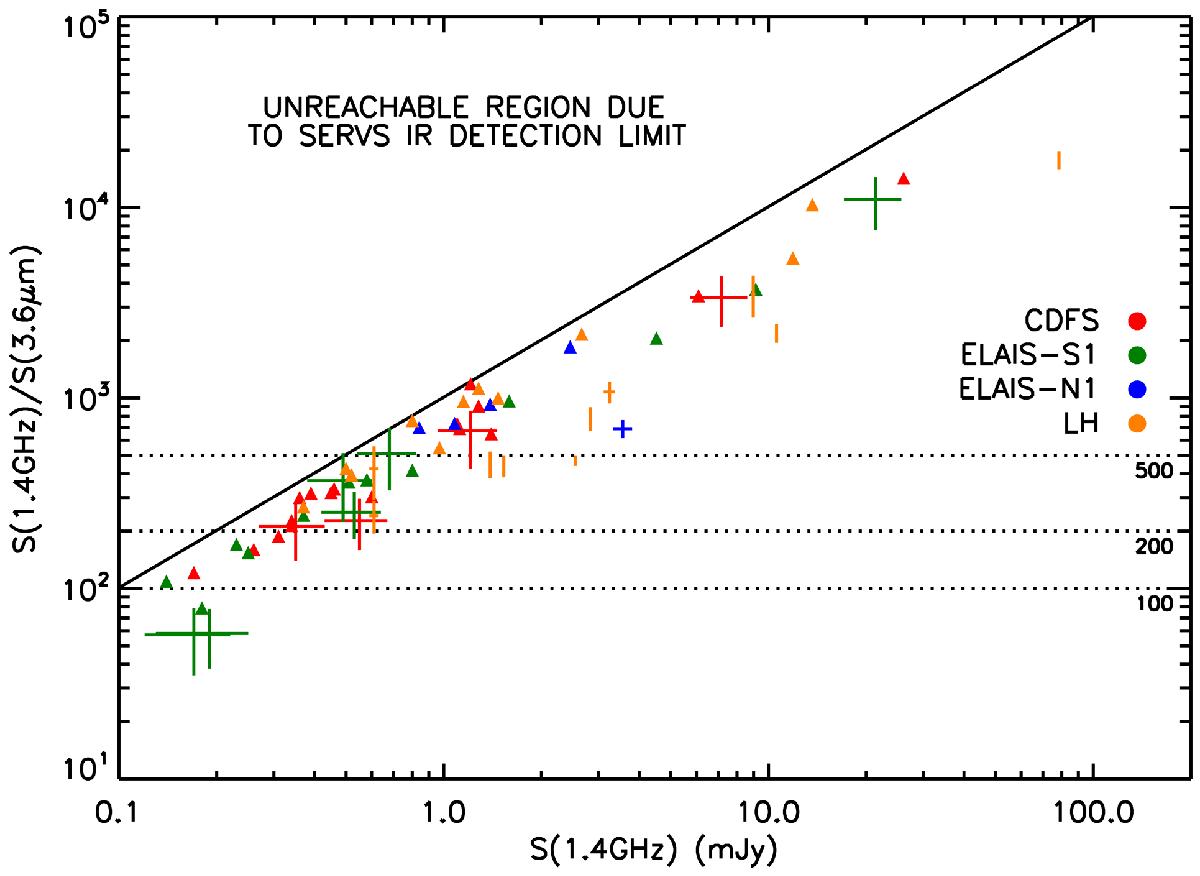
1.4 GHz-to-3.6 μm flux density ratios versus 1.4 GHz radio flux density. The diagonal solid line marks the lowest R3.6 values we can trace due to the combined radio and SERVS detection limits (derived assuming S1.4 GHz > 100 μJy and S3.6 μm > 1 μJy, i.e., the smallest lower limit we measure in our sample). The dotted lines indicate flux density ratios R3.6 = 100, 200, and 500. Flux ratios for reliably IR-detected IFRSs are reported as crosses (position with errors bars), while flux ratios of IR undetected/unreliable sources are indicated by triangles (lower limits). To each field corresponds a different colour, as explained in the legend.
Current usage metrics show cumulative count of Article Views (full-text article views including HTML views, PDF and ePub downloads, according to the available data) and Abstracts Views on Vision4Press platform.
Data correspond to usage on the plateform after 2015. The current usage metrics is available 48-96 hours after online publication and is updated daily on week days.
Initial download of the metrics may take a while.