Fig. 3
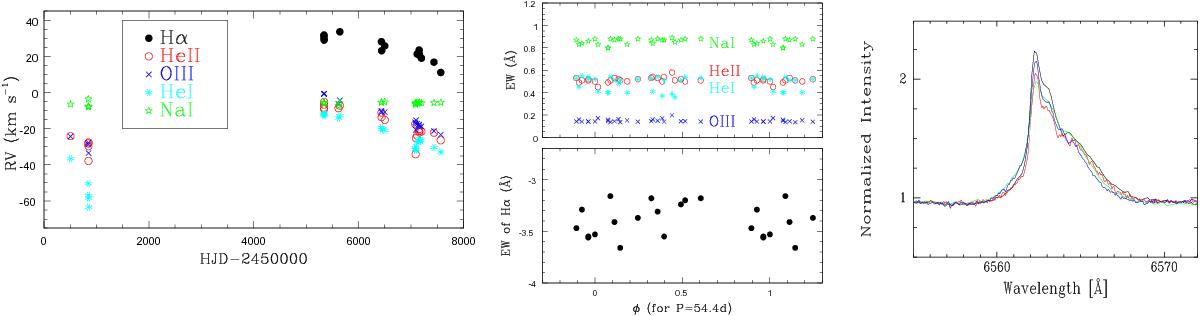
Left and middle: RVs (left panel) and EWs (middle panel) of selected lines (He ii 4686 shown as open red circles, O iii 5592 as blue crosses, He i 5876 as cyan asterisks, Na i 5890 as green stars, and Hα as black dots) as a function of time or phase (with 1 /P = 0.01838 d-1 and T0 = 2 451 751.707), respectively. Typical errors are <5 km s-1 for RVs and <10% for EWs (see Table 4). Right: Hα profile observed in 2010 (black, HJD = 2 453 40.538), 2011 (red, HJD = 2 455 642.689), 2013 (green, HJD = 2 456 498.481), and 2015 (blue, HJD = 2 457 116.539).
Current usage metrics show cumulative count of Article Views (full-text article views including HTML views, PDF and ePub downloads, according to the available data) and Abstracts Views on Vision4Press platform.
Data correspond to usage on the plateform after 2015. The current usage metrics is available 48-96 hours after online publication and is updated daily on week days.
Initial download of the metrics may take a while.