Free Access
Fig. 2
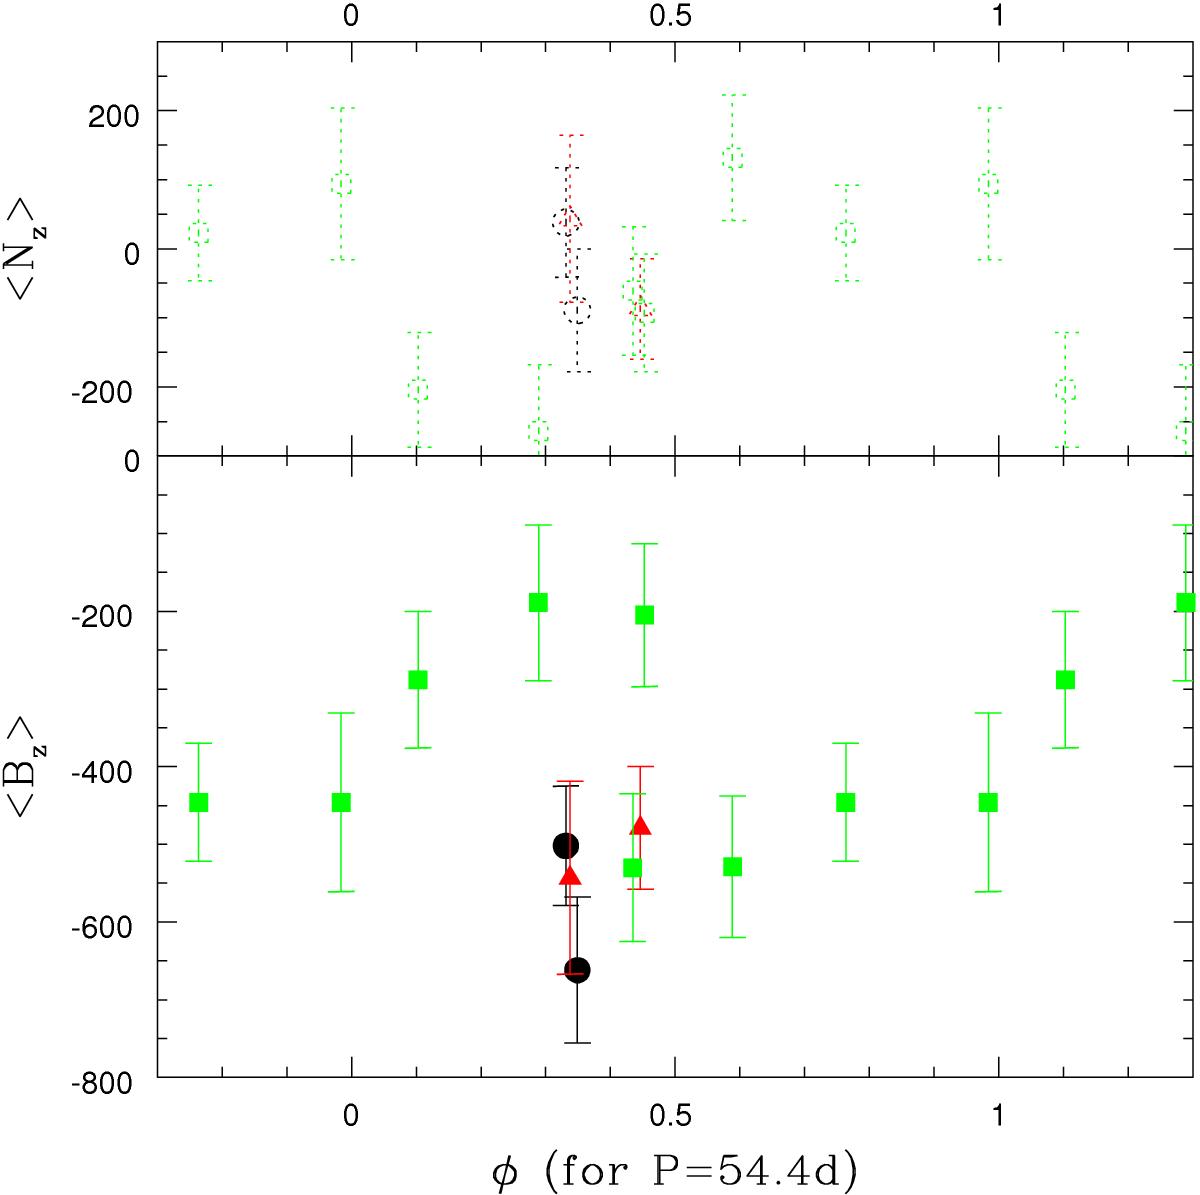
Longitudinal field values (filled symbols) and the associated values for the null profiles (dotted empty symbols) as a function of phase (with 1 /P = 0.01838 d-1 and T0 = 2 451 751.707). The black circles correspond to 2011 data, the red triangles to 2013 data, and the green squares to 2015 data.
Current usage metrics show cumulative count of Article Views (full-text article views including HTML views, PDF and ePub downloads, according to the available data) and Abstracts Views on Vision4Press platform.
Data correspond to usage on the plateform after 2015. The current usage metrics is available 48-96 hours after online publication and is updated daily on week days.
Initial download of the metrics may take a while.