Fig. 1
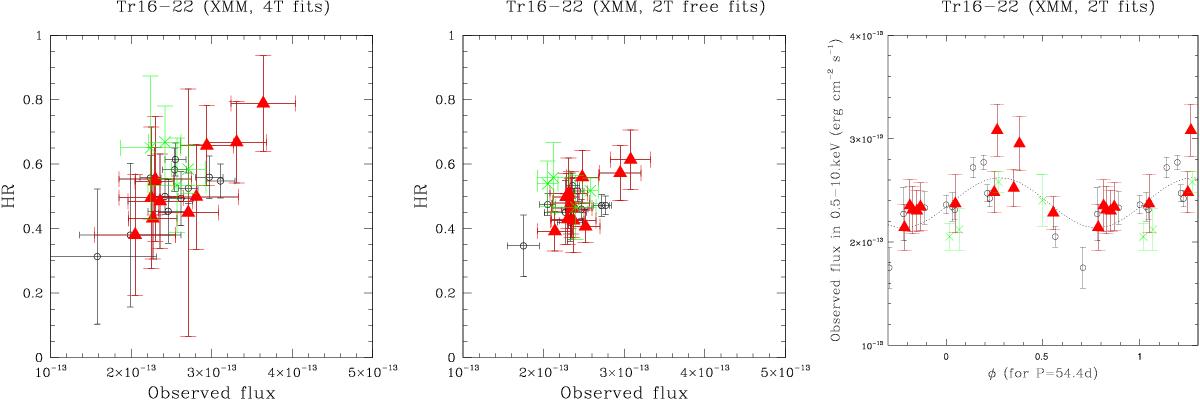
Left and middle: evolution of the hardness ratios (HR = H/S = FISMcor(2.−10.0 keV) /FISMcor(0.5−2. keV)) as a function of observed fluxes. Red triangles correspond to the 2003 XMM-Newton data (the year with the largest number of observations), green crosses to the new data, and black open circles to the other XMM-Newton observations. The values shown in the left (resp. middle) panel correspond to the results from 4T fits (resp. 2T fits). Right: evolution of the observed fluxes from 2T fits as a function of phase (with 1 /P = 0.01838 d-1 and T0 = 2 451 751.707), along with the best-fit sinusoid (dotted line).
Current usage metrics show cumulative count of Article Views (full-text article views including HTML views, PDF and ePub downloads, according to the available data) and Abstracts Views on Vision4Press platform.
Data correspond to usage on the plateform after 2015. The current usage metrics is available 48-96 hours after online publication and is updated daily on week days.
Initial download of the metrics may take a while.