Fig. 2
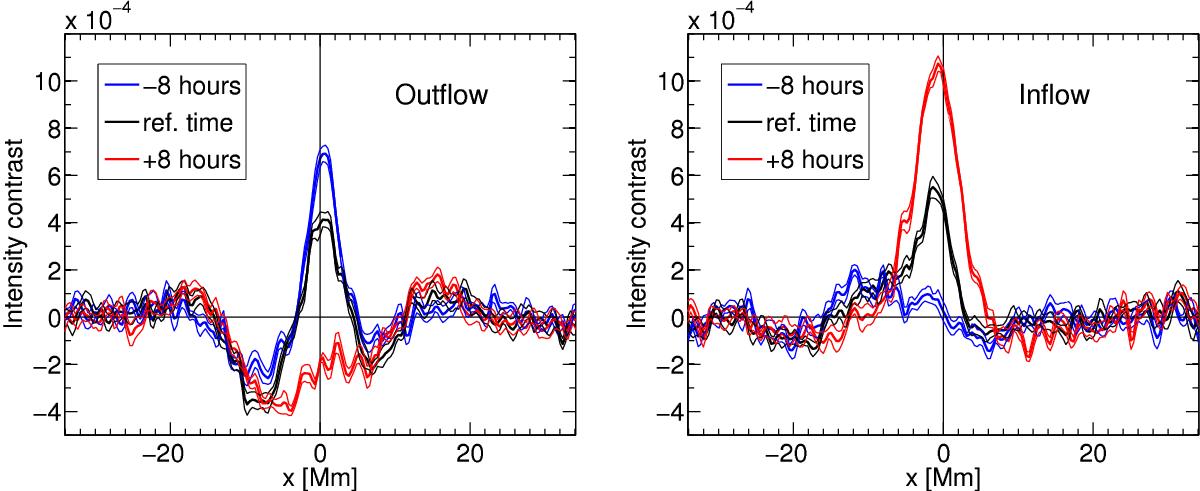
Temporal evolution of the intensity contrast for the average supergranular outflow and inflow. Each curve is a mean over five 8 h segments at the equator around the central meridian, averaged over one year and cut along y = 0. The thin lines give the 1σ level of the variability, as computed from dividing one year of data into eight parts.
Current usage metrics show cumulative count of Article Views (full-text article views including HTML views, PDF and ePub downloads, according to the available data) and Abstracts Views on Vision4Press platform.
Data correspond to usage on the plateform after 2015. The current usage metrics is available 48-96 hours after online publication and is updated daily on week days.
Initial download of the metrics may take a while.