Fig. A.2
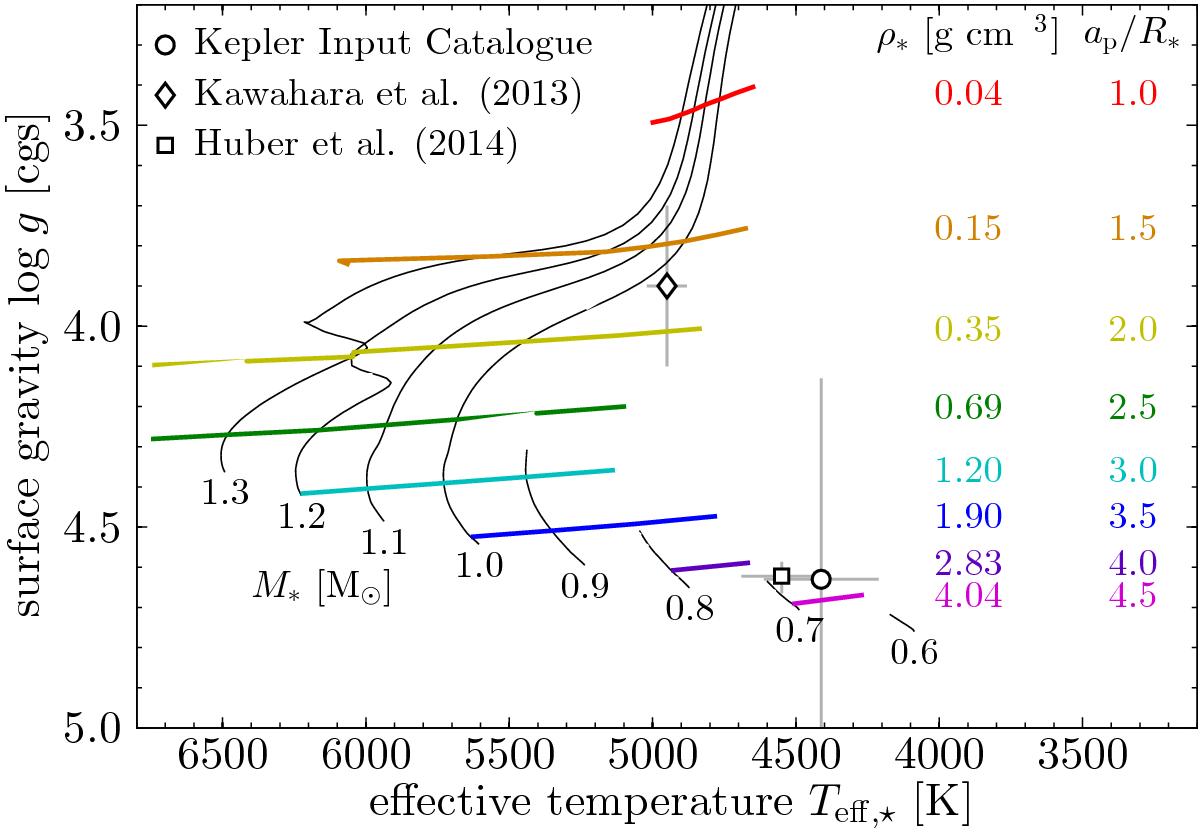
Estimates of the effective temperature Teff,⋆ and surface gravity log 1 of the star KIC 12557548, compared with predictions of stellar models. The symbols mark the different observational estimates of the stellar parameters from Table A.1. The thin black lines show Yonsei-Yale stellar evolutionary tracks for different stellar masses, indicated in solar units at the base of each track. The tracks start at the zero-age main sequence and they are truncated at an age of 13.8 Gyr (only relevant for stars with M⋆< 1.0M⊙). As stars evolve, they move upward in this diagram, following the tracks toward lower values of log 1. The thick coloured lines are curves of constant mean stellar density ρ⋆. The table on the right shows the values of mean stellar density corresponding to the different lines and the values of the scaled semi-major axis ap/R⋆ of planet KIC 1255b that correspond to these densities.
Current usage metrics show cumulative count of Article Views (full-text article views including HTML views, PDF and ePub downloads, according to the available data) and Abstracts Views on Vision4Press platform.
Data correspond to usage on the plateform after 2015. The current usage metrics is available 48-96 hours after online publication and is updated daily on week days.
Initial download of the metrics may take a while.