Fig. 7
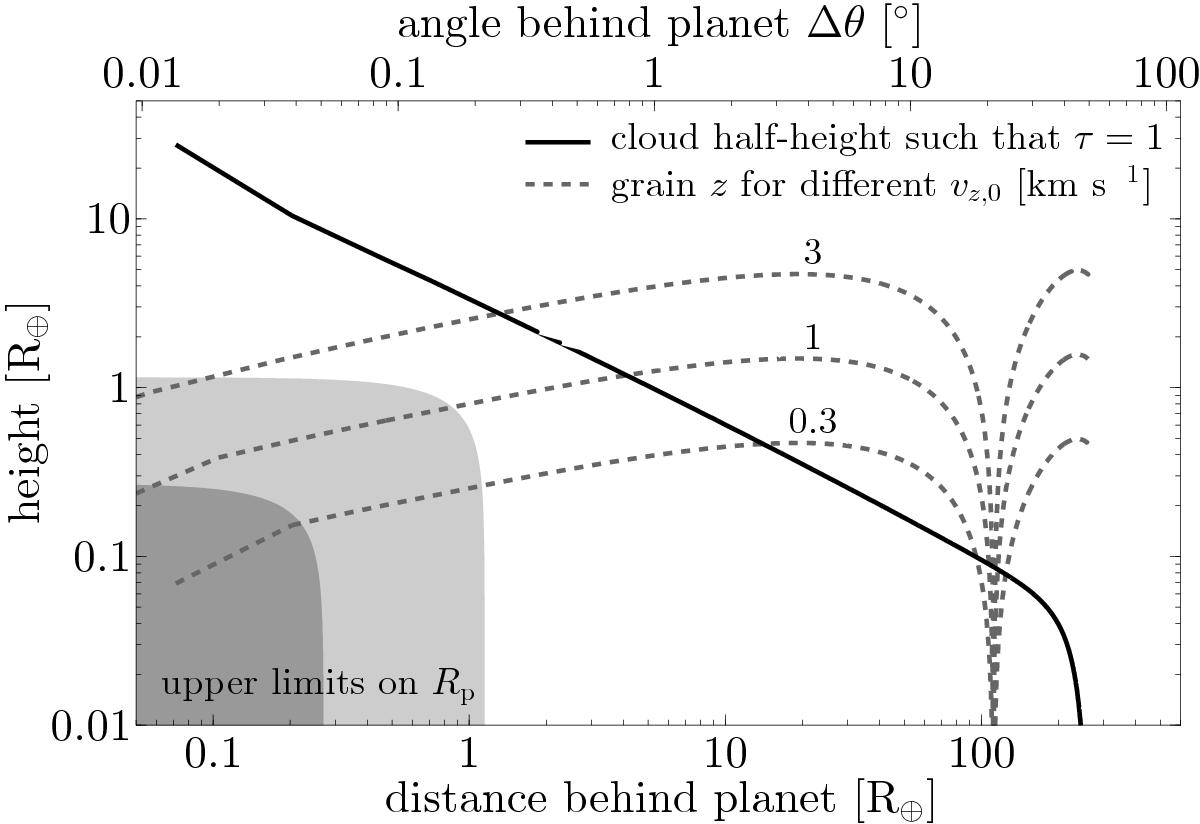
Diagram to illustrate for what part of the tail the assumption of an optically thin dust cloud is valid. The solid line shows hτ = 1, the dust cloud half-height for which the radial optical depth equals unity. The dashed lines give the heights above the planet’s orbital plane reached by dust grains that are launched vertically from the planet with different initial vertical speeds vz,0. Distances on the bottom axis are measured along the planet’s orbit. All curves are drawn for a typical model realisation. The shaded regions in the lower left indicate upper limits on the planet’s radius based on (1) the absence of transits in part of the Kepler data (light grey; Rp< 1.15R⊕(1σ); Brogi et al. 2012) and (2) the planet-mass-dependent mass loss rate (dark grey; Rp ≲ 0.3R⊕, model-dependent; Perez-Becker & Chiang 2013).
Current usage metrics show cumulative count of Article Views (full-text article views including HTML views, PDF and ePub downloads, according to the available data) and Abstracts Views on Vision4Press platform.
Data correspond to usage on the plateform after 2015. The current usage metrics is available 48-96 hours after online publication and is updated daily on week days.
Initial download of the metrics may take a while.