Fig. 6
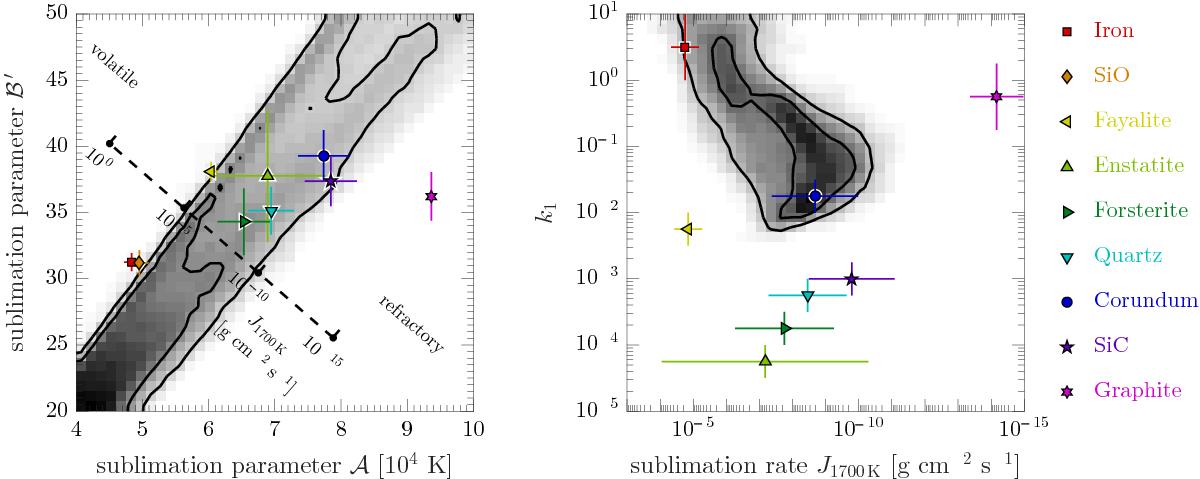
Comparison between our model results and the laboratory-measured properties of some real dust species, as listed in Table 5, for the model parameters that provide meaningful constraints on the dust composition. Left: constraints on the parameters that describe the temperature dependence of dust sublimation. The dashed diagonal axis shows how J1700 K (the sublimation rate of dust at 1700 K) varies with ![]() and ℬ′. Right: combined constraints on k1 (the imaginary part of the complex refractive index for λ< 8μm) and the 1700 K sublimation rate. Note that the sublimation rate decreases to the right.
and ℬ′. Right: combined constraints on k1 (the imaginary part of the complex refractive index for λ< 8μm) and the 1700 K sublimation rate. Note that the sublimation rate decreases to the right.
Current usage metrics show cumulative count of Article Views (full-text article views including HTML views, PDF and ePub downloads, according to the available data) and Abstracts Views on Vision4Press platform.
Data correspond to usage on the plateform after 2015. The current usage metrics is available 48-96 hours after online publication and is updated daily on week days.
Initial download of the metrics may take a while.