Fig. 5
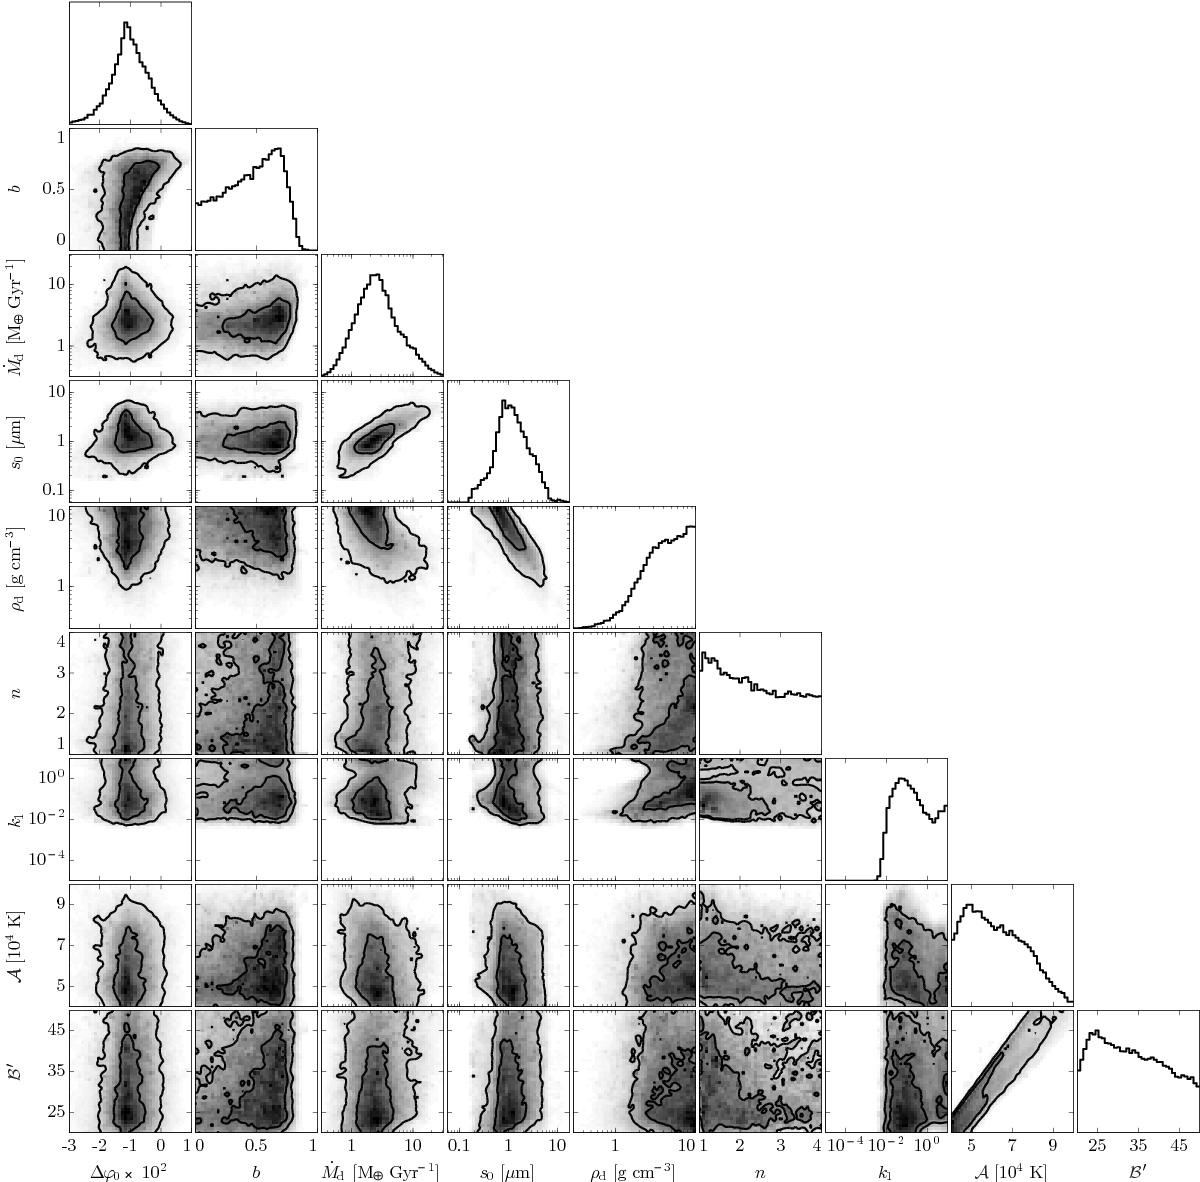
Posterior probability distribution over the free parameters of the model resulting from the MCMC analysis. See Table 3 for a description of the free parameters. Panels along the diagonal: one-dimensional projections (marginalised over all other parameters) of the probability density function. Off-diagonal panels: two-dimensional projections showing correlations between parameters. The grey-scale colours are proportional to the probability density (normalised per panel). Contours are drawn at 1σ and 2σ levels.
Current usage metrics show cumulative count of Article Views (full-text article views including HTML views, PDF and ePub downloads, according to the available data) and Abstracts Views on Vision4Press platform.
Data correspond to usage on the plateform after 2015. The current usage metrics is available 48-96 hours after online publication and is updated daily on week days.
Initial download of the metrics may take a while.