Fig. B.1
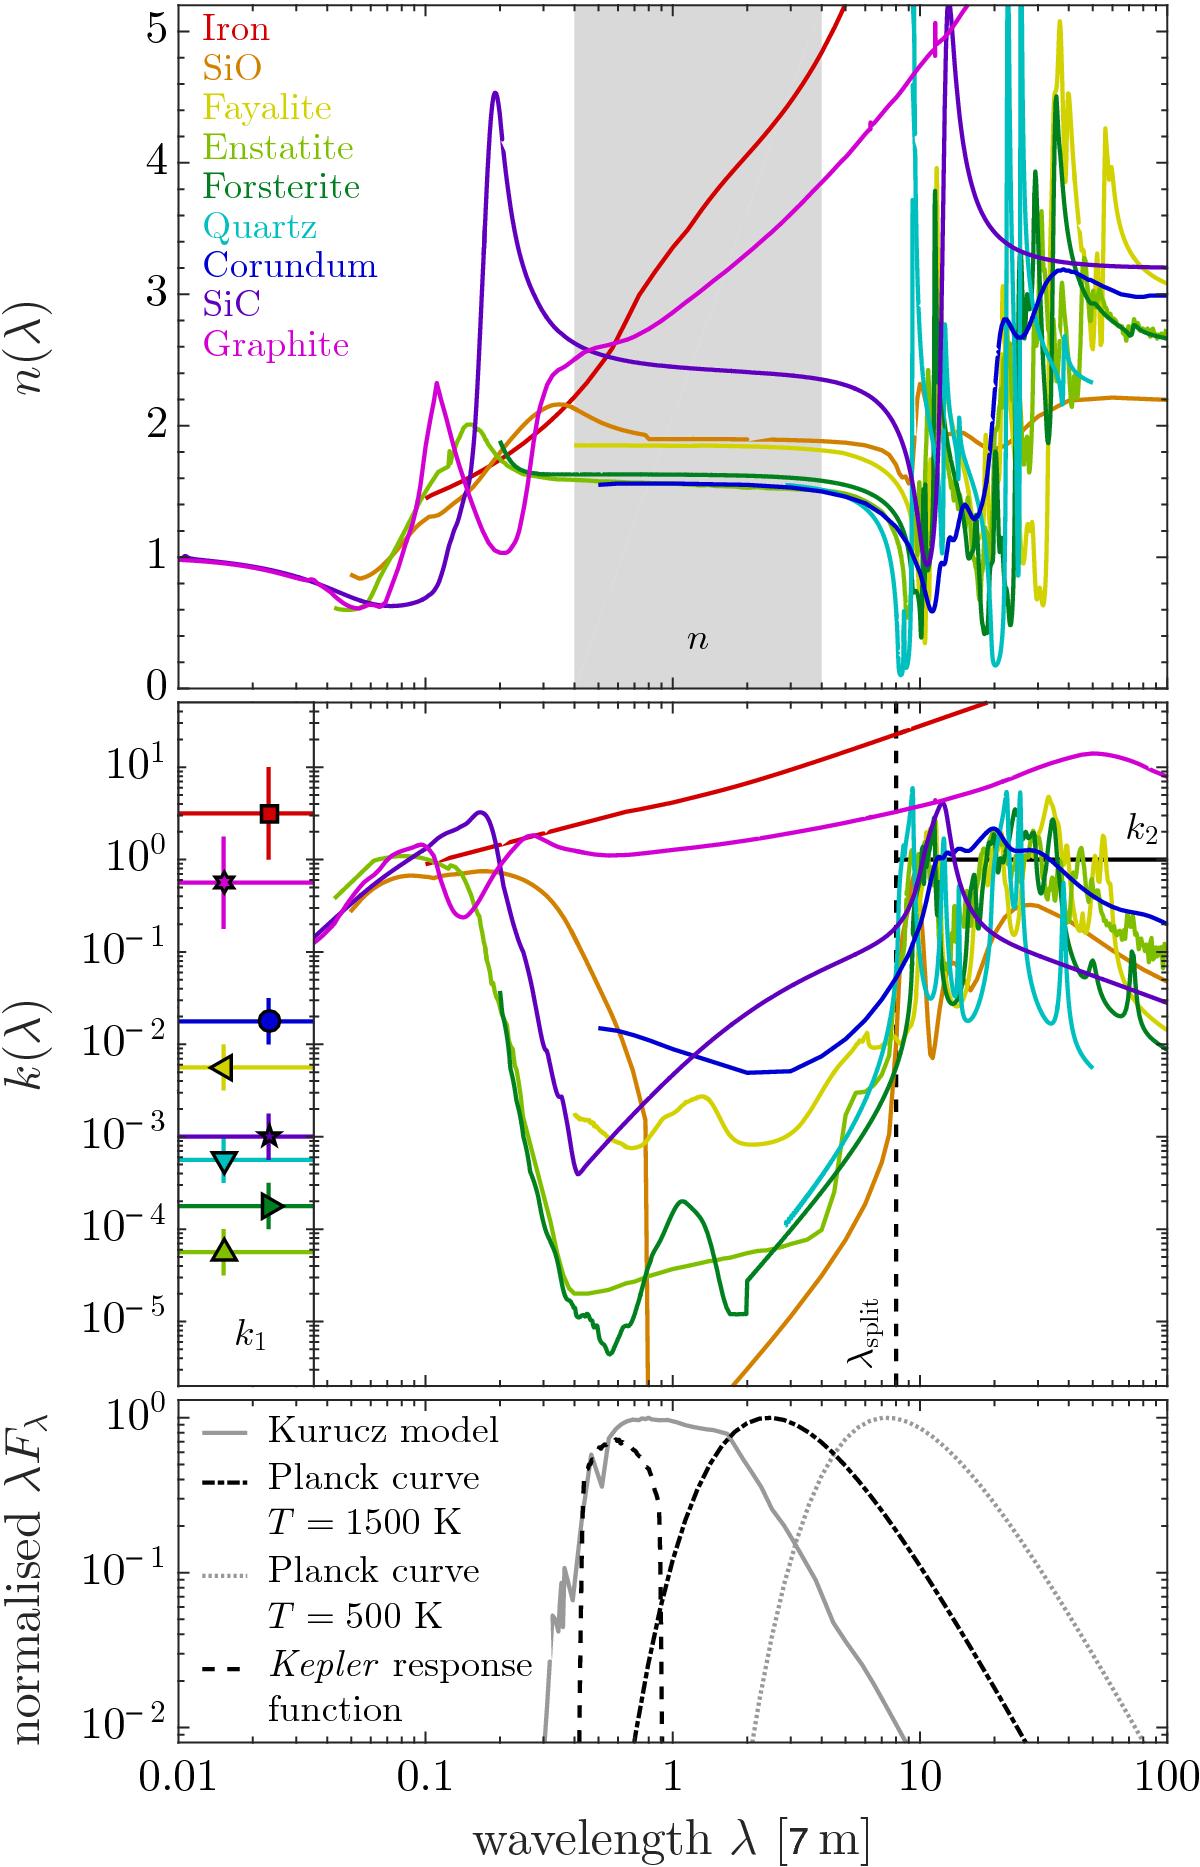
Complex refractive indices as a function of wavelength for the dust species considered in this study. Top: the real part of the complex refractive index n(λ). The grey area indicates the range in wavelength used to determine the values of n listed in Table 5. Middle right: the imaginary part of the complex refractive index k(λ). The vertical dashed line at 8μm marks λsplit, which is the boundary between k1 and k2, the two constant values of the imaginary part of the complex refractive index used in our recipe. The horizontal black line at unity marks the value we use for k2. Middle left: the values of k1 (listed in Table 5) that best reproduce the Td(s) profiles of the various materials. The symbols are offset horizontally for visibility only. No symbol is shown for SiO, since its temperatures cannot be reproduced by our complex-refractive-index recipe. Bottom: the spectrum of the Kurucz model atmosphere that we use for the host star KIC 12557548, together with thermal emission spectra of dust at different temperatures, all normalised to unity. Also shown is the Kepler response function (not normalised), for which the vertical axis should read “response”.
Current usage metrics show cumulative count of Article Views (full-text article views including HTML views, PDF and ePub downloads, according to the available data) and Abstracts Views on Vision4Press platform.
Data correspond to usage on the plateform after 2015. The current usage metrics is available 48-96 hours after online publication and is updated daily on week days.
Initial download of the metrics may take a while.