Fig. 1
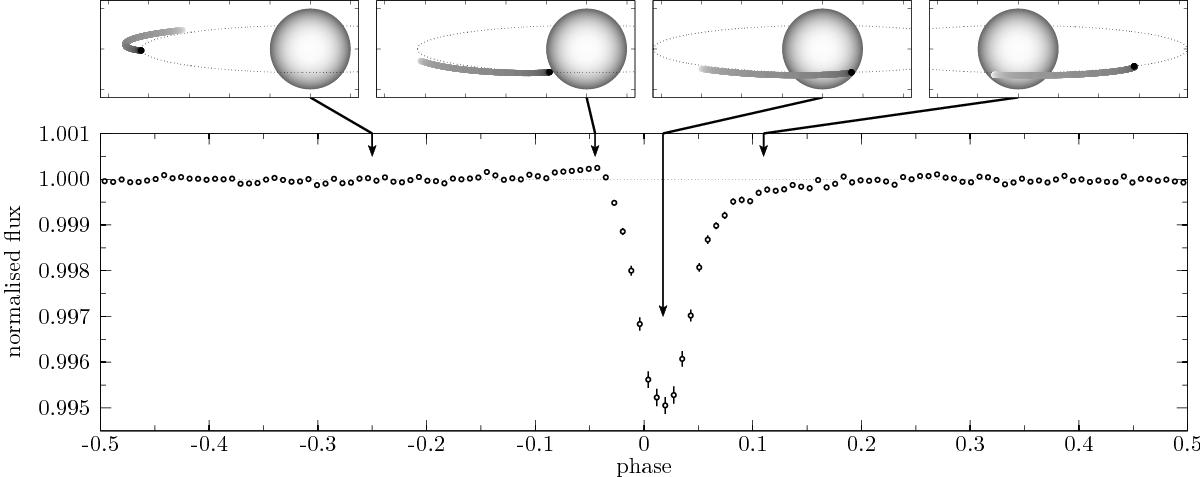
Phase-folded long-cadence Kepler light curve of KIC 1255b (bottom), together with schematic views of the system at different orbital phases (top), illustrating how an asymmetric dust cloud can explain the peculiar transit profile. Arrows indicate which sketch corresponds to which orbital phase. For details on the observational data, see Sect. 2.3.1 of this work and Sect. 2 of van Werkhoven et al. (2014). The error bars on flux include the spread caused by the variability in transit depth, making the in-transit error bars greater than the out-of-transit ones (which are mostly smaller than the size of the symbols). In the sketches, the star, the orbit of the planet, and the length of the dust tail are all drawn to scale; the tick marks on the axes are spaced one stellar radius apart. The vertical thickness of the dust cloud and its colour gradient (which illustrates the gradually decreasing dust density) are chosen for illustrative purposes.
Current usage metrics show cumulative count of Article Views (full-text article views including HTML views, PDF and ePub downloads, according to the available data) and Abstracts Views on Vision4Press platform.
Data correspond to usage on the plateform after 2015. The current usage metrics is available 48-96 hours after online publication and is updated daily on week days.
Initial download of the metrics may take a while.