Fig. 9
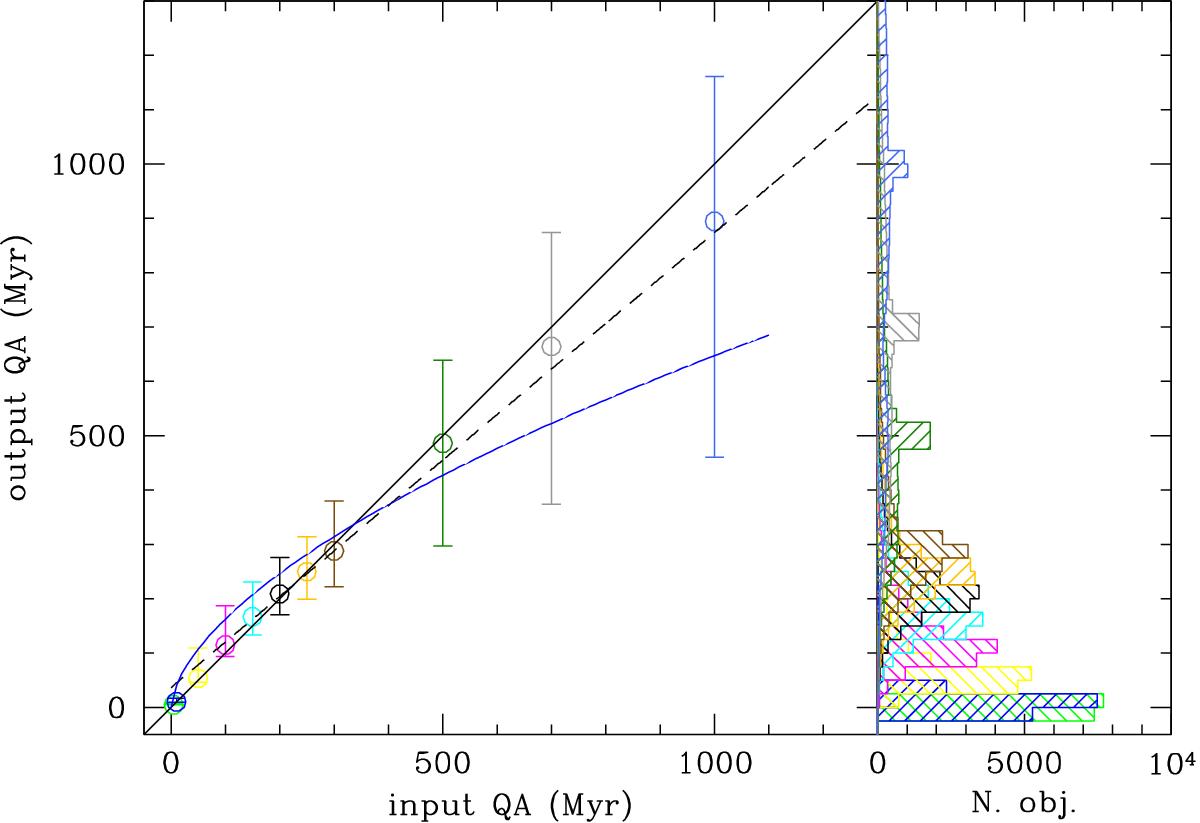
Relationship between the input quenching age of the simulated galaxies and the output quenching age derived from the PDF analysis of the mock SED restricted to galaxies with an input quenching factor QF> 0.5 (left panel). Dots are median values and error bars are the 16% and 84% quartiles of the distribution. The solid line shows the 1:1 relationship, the dashed line the linear best fit to the data, and the blue solid line a polynomial fit derived for the whole mock sample shown in Fig. 8. The right panel shows the distribution of output quenching ages derived from the PDF analysis for a given value of the input quenching age for the simulated galaxies.
Current usage metrics show cumulative count of Article Views (full-text article views including HTML views, PDF and ePub downloads, according to the available data) and Abstracts Views on Vision4Press platform.
Data correspond to usage on the plateform after 2015. The current usage metrics is available 48-96 hours after online publication and is updated daily on week days.
Initial download of the metrics may take a while.